. 1998 Feb;111(2):343-62.
doi: 10.1085/jgp.111.2.343.

Time-irreversible subconductance gating associated with Ba2+ block of large conductance Ca2+-activated K+ channels

Affiliations

Time-irreversible subconductance gating associated with Ba2+ block of large conductance Ca2+-activated K+ channels

R A Bello et al. J Gen Physiol. 1998 Feb.

Abstract

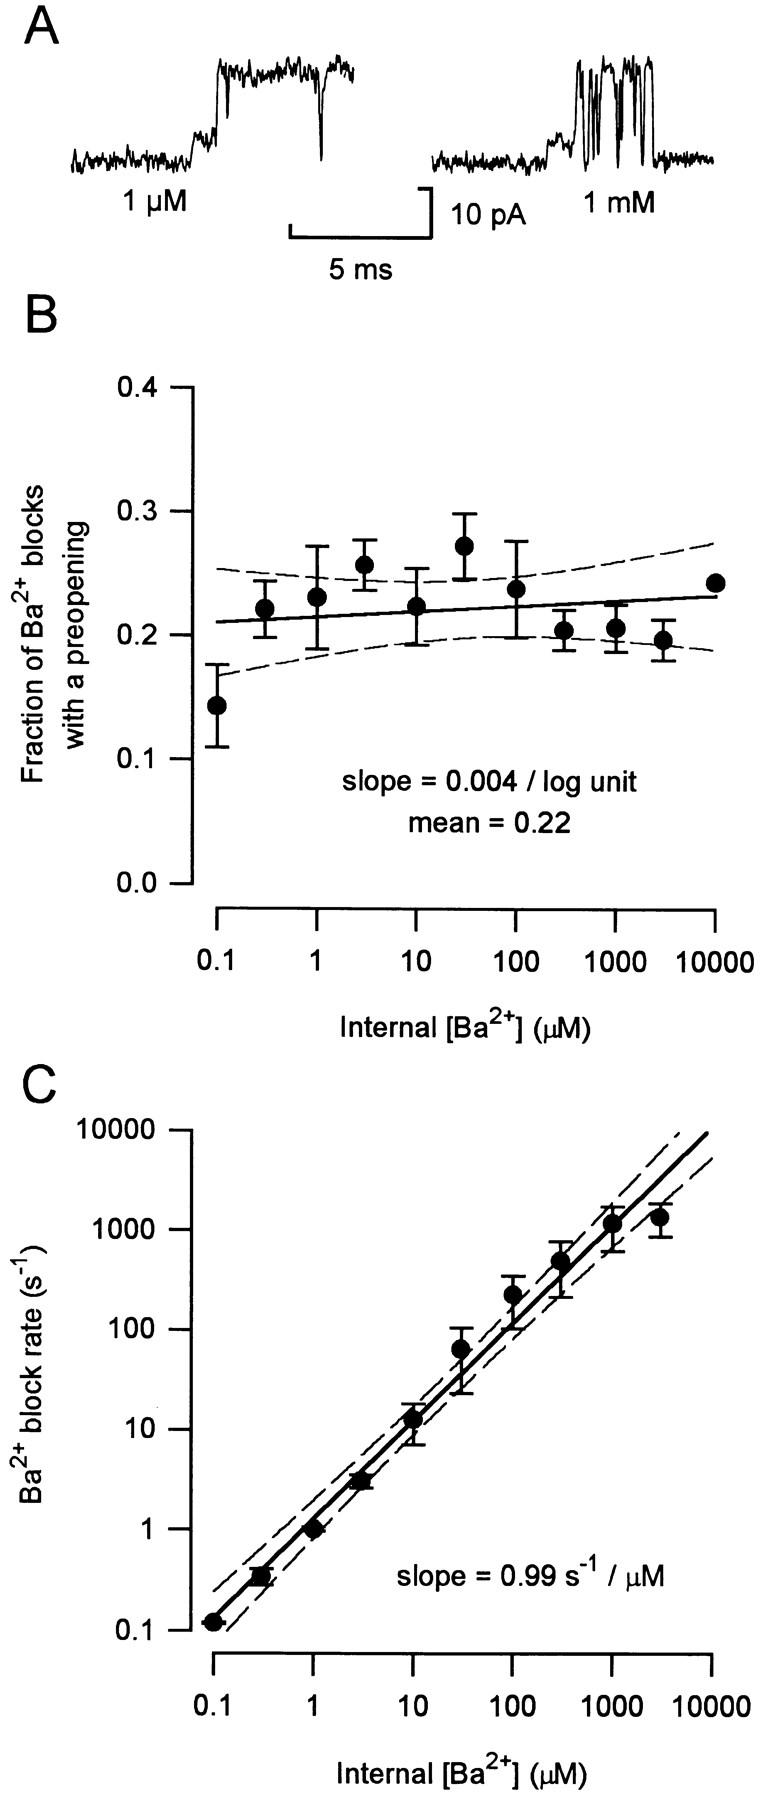
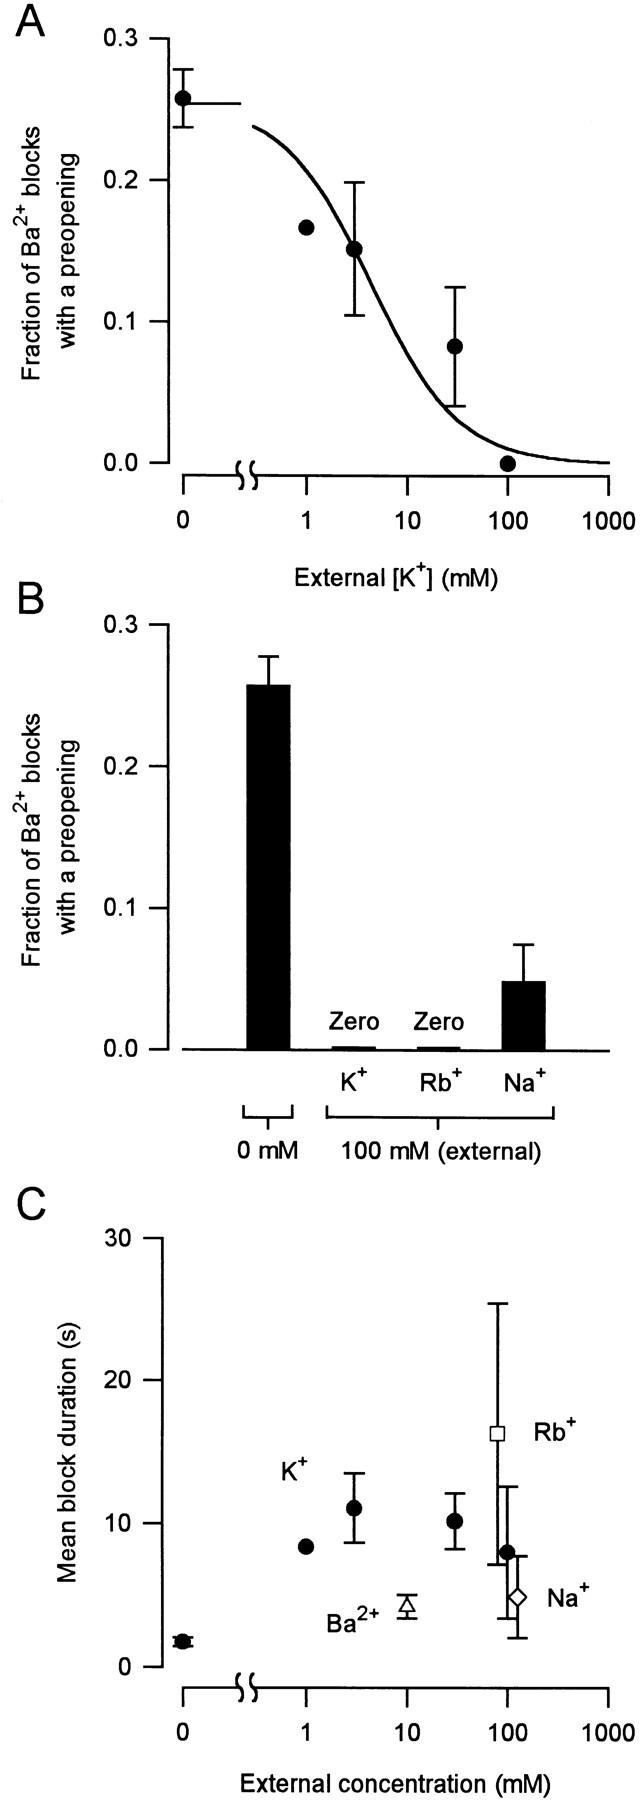
Ba2+ block of large conductance Ca2+-activated K+ channels was studied in patches of membrane excised from cultures of rat skeletal muscle using the patch clamp technique. Under conditions in which a blocking Ba2+ ion would dissociate to the external solution (150 mM N-methyl-D-glucamine+o, 500 mM K+i, 10 microM Ba2+i, +30 mV, and 100 microM Ca2+i to fully activate the channel), Ba2+ blocks with a mean duration of approximately 2 s occurred, on average, once every approximately 100 ms of channel open time. Of these Ba2+ blocks, 78% terminated with a single step in the current to the fully open level and 22% terminated with a transition to a subconductance level at approximately 0.26 of the fully open level (preopening) before stepping to the fully open level. Only one apparent preclosing was observed in approximately 10,000 Ba2+ blocks. Thus, the preopenings represent Ba2+-induced time-irreversible subconductance gating. The fraction of Ba2+ blocks terminating with a preopening and the duration of preopenings (exponentially distributed, mean = 0.75 ms) appeared independent of changes in [Ba2+]i or membrane potential. The fractional conductance of the preopenings increased from 0.24 at +10 mV to 0.39 at +90 mV. In contrast, the average subconductance level during normal gating in the absence of Ba2+ was independent of membrane potential, suggesting different mechanisms for preopenings and normal subconductance levels. Preopenings were also observed with 10 mM Ba2+o and no added Ba2+i. Adding K+, Rb+, or Na+ to the external solution decreased the fraction of Ba2+ blocks with preopenings, with K+ and Rb+ being more effective than Na+. These results are consistent with models in which the blocking Ba2+ ion either induces a preopening gate, and then dissociates to the external solution, or moves to a site located on the external side of the Ba2+ blocking site and acts directly as the preopening gate.


Figures

Figure 1
Figure 1
Computer display of a single channel current showing the setting of the cursor lines to measure the amplitude and duration of a preopening after a Ba2+ block.
Figure 2
Figure 2
Block of BK channels by internal Ba2+. (A and B) Continuous records of current flowing through a single BK channel in an inside-out patch of membrane from cultured rat skeletal muscle in the absence (A) and after adding 10 μM Ba2+ to the internal solution (B). Upward deflections indicate channel opening. (C) Blocking and unblocking transitions of the six Ba2+ blocks, indicated in B with asterisks are presented on a faster time scale. The gaps in the current record during the zero current levels indicate excluded time during the Ba2+ blocks. Two of the unblocking transitions occur in two steps, with a transition through a subconductance level (preopening). The solution bathing the normal intracellular side of the membrane (internal solution) contained 500 mM KCl, 100 μM Ca2+, and 5 mM TES buffer. The solution bathing the normal extracellular side of the membrane (external solution) contained 150 mM NMDG-Cl and 5 mM TES buffer. The membrane potential was +30 mV (inside positive).
Figure 3
Figure 3
Examples of preopenings after Ba2+ blocks for three different classes of preopenings (see text). All transitions were from the experiment in Fig. 2 B. +30 mV.
Figure 4
Figure 4
Preopenings, but not preclosings, are associated with Ba2+ blocks. (A) Hypothetical preclosing. (B) Typical preopening after a Ba2+ block. (C) Fraction of Ba2+ blocks with preopenings or preclosings. The error bar indicates the SEM for 10 experiments. Same experimental conditions as for Fig. 2. +30 mV.
Figure 5
Figure 5
Internal Ba2+ concentration has little effect on the fraction of Ba2+ blocks with a preopening. (A) Current traces showing typical preopenings observed in 1 μM and 1 mM internal Ba2+. (B) Fraction of Ba2+ blocks with a preopening at the indicated concentrations of internal Ba2+. Each plotted symbol with error bars indicates the mean ± SEM of the examined experiments at each concentration. (For B and C of this figure, and for Figs. 6 and 7, the number of experiments per plotted point were, from left to right: 2, 5, 4, 3, 10, 5, 5, 4, 4, 4, 1.) The continuous line is a least-squares fit to the following equation: fraction = m{log10[[Ba2+]i(μM)]} + b, where m is the slope of the line and b is the intercept. In this and the following figures of similar format, the dashed lines represent the 95% confidence limits for the fitted line. Same experimental conditions as for Fig. 2, except for the internal concentrations of Ba+. +30 mV.
Figure 6
Figure 6
Internal Ba2+ concentration has little effect on the mean duration of the preopenings. (A) Current traces showing that the duration of the preopenings was measured from the start of the preopening to the time of the transition to the fully open level, including any closed time during this period. (B) Cumulative distribution of the durations of the preopenings are measured as shown in A. The continuous line plots the number of preopenings lasting as long or longer than the indicated duration. The dashed line is the maximum likelihood fit to a single exponential function of the following form: No. of observations = A exp(−t /τ), where A is the total number of preopenings in the distribution, τ is the time constant (mean duration) of the intervals in the distribution, and exp is an exponential function. 10 μM internal Ba2+. (C) Mean duration of the preopenings at the indicated internal Ba2+ concentrations. Same experimental conditions and experiments as for Fig. 5. +30 mV.
Figure 7
Figure 7
Internal Ba2+ concentration has little effect on the fractional conductance of preopenings. The fractional amplitudes of the preopenings are plotted against the Ba2+ concentrations. Same experimental conditions and experiments as in Fig. 5. +30 mV.
Figure 8
Figure 8
Effect of membrane potential on the fraction of Ba2+ blocks with a preopening (A) and on the mean duration of the preopenings (B). Each plotted symbol with error bars indicates the mean ± SEM of the examined experiments at the indicated voltage. For A and B of this figure, and for Fig. 9, B and C, the numbers of experiments per plotted point were (from left to right): 2, 10, 5, 3, 2. Same experimental conditions as for Fig. 2.
Figure 9
Figure 9
The fractional conductance of preopenings increases when the membrane potential is made more positive. (A) Current traces of typical preopenings observed at +10 and +90 mV. (B) Current–voltage plot for the preopening and fully open current levels. The dashed lines have no theoretical basis. (C) Fractional current of the preopenings compared with the fully open current at the indicated membrane potentials. The slope of the fitted line was significantly different from zero (P < 0.0001). Same experimental conditions and experiments as for Fig. 8.
Figure 10
Figure 10
Preopenings are different from subconductance levels observed during normal gating. (A) Current traces recorded at +90 mV of a typical subconductance level observed during normal gating and of a typical preopening. (B) Mean fractional conductances of all subconductance levels <50% of the fully open level during normal gating and of preopenings. Estimates were made at both +30 and +90 mV. The black and gray bars plot the results for two separate channels. The subconductance levels were obtained from currents recorded in the absence of added Ba2+ and the preopenings were recorded with 10 μM internal Ba2+. The concentrations of the other ions in the solutions were the same as for Fig. 2.
Figure 11
Figure 11
External K+, Rb+, or Na+ reduces the fraction of blocks with preopenings. (A) Fraction of Ba2+ blocks that contain a preopening in the presence of the indicated external K+ concentrations with equimolar replacement of external NMDG+ with K+. The internal Ba2+ was 3 μM. The cation in the internal solution was 500 mM K+. Each of the plotted symbols with error bars indicate the mean ± SEM for the experiments under the indicated conditions. The numbers of experiments per plotted point were (from left to right): 3, 1, 3, 2, 5. The continuous line is a least-squares fit by the inhibition equation: fraction = f max {f max/[1 + ([K+]o/K i)]}, where f max is the fraction of Ba2+ blocks that contain a preopening with 0 mM external K+, and Ki is concentration at half maximal inhibition. The fitted Ki is 6.6 mM and the fitted f max is 0.26. (B) Fraction of Ba2+ blocks with a preopening with 100 mM external Rb+ or Na+ replacing 100 mM NMDG+. The bars for 0 and 100 mM external K+ are replotted from A for comparison. Each bar with associated error bar indicates the mean ± SEM for (left to right) 3, 5, 3, and 4 data sets. (C) Mean duration of the Ba2+ blocks observed at the indicated external ion concentration for the experiments shown in A and B. Each symbol (• for K+, □ for Rb+, ⋄ for Na+, and ▵ for Ba2+) plots the average of the time constants obtained from the fits to the exponential component defining Ba2+ block (see methods). The experiments are the same as in A and B, except for Ba2+, which is from four experiments.
Figure 12
Figure 12
Preopenings are observed with Ba2+ in the external solution. (A) Current traces of preopenings observed in the presence of 10 mM internal or external Ba2+. (B) Fraction of Ba2+ blocks with a preopening in the presence of 10 mM internal or external Ba2+. The bar for 10 mM internal Ba2+ is replotted from the data in Fig. 5. The mean ± SEM with 10 mM external Ba2+ is based on data from four experiments.
Figure 13
Figure 13
Model 1. A cartoon for generation of preopenings when Ba2+ forms the preopening gate. (A) Generation of preopenings with 0 mM external K+. Below the model are hypothetical single-channel currents and indicated state transitions for Ba2+ blocks with (top) and without (bottom) preopenings. (B) Absence of preopenings with 100 mM external K+. See text for descriptions of the models.
Figure 14
Figure 14
Model 2. A cartoon for preopenings when Ba2+ induces a preopening gate. (A) Generation of preopenings with 0 mM external K+. Below the model are hypothetical single-channel currents and indicated state transitions for Ba2+ blocks with (top) and without (bottom) preopenings. (B) Absence of preopenings with 100 mM external K+. See text for description of the models.

Similar articles

Cited by

References

    1. Armstrong CM. Interaction of tetraethylammonium ion derivatives with the potassium channel of giant axons. J Gen Physiol. 1971;58:413–437. - PMC - PubMed
    1. Armstrong, C.M. 1975. Potassium pores of nerve and muscle membranes. In Membranes. Volume 3. G. Eisenman, editor. Marcel Dekker, Inc. New York. 325–357. - PubMed
    1. Armstrong CM, Taylor SR. Interaction of barium ions with potassium channels in squid giant axons. J Gen Physiol. 1980;30:473–488. - PMC - PubMed
    1. Armstrong CM, Palti Y. Potassium channel block by internal calcium and strontium. J Gen Physiol. 1991;97:627–638. - PMC - PubMed
    1. Armstrong CM, Swenson RP, Taylor SR. Block of squid axon K channels by internally and externally applied barium ions. J Gen Physiol. 1982;80:663–682. - PMC - PubMed

Publication types