. 1998 Feb;70(2):635-45.
doi: 10.1046/j.1471-4159.1998.70020635.x.

Opioid modulation of extracellular signal-regulated protein kinase activity is ras-dependent and involves Gbetagamma subunits

Affiliations

Opioid modulation of extracellular signal-regulated protein kinase activity is ras-dependent and involves Gbetagamma subunits

M M Belcheva et al. J Neurochem. 1998 Feb.

Abstract

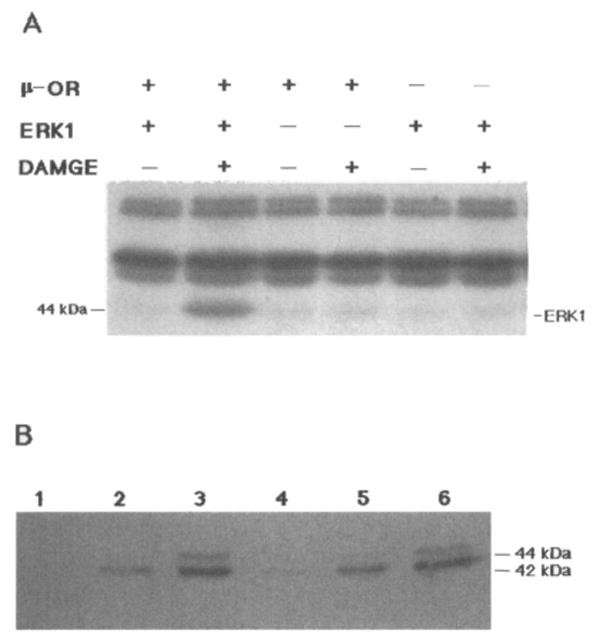
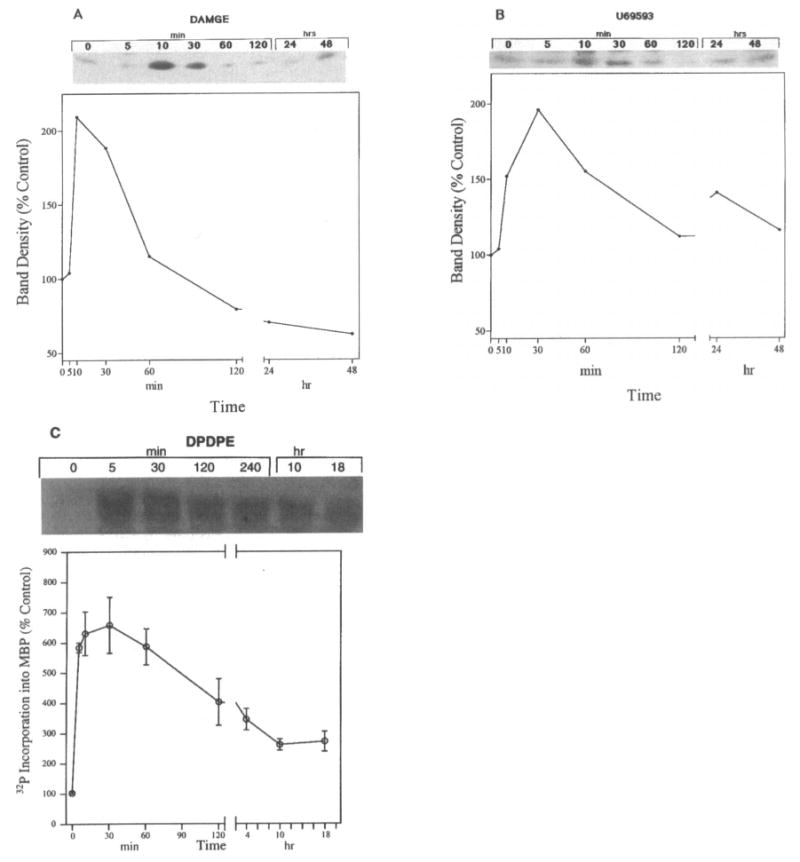
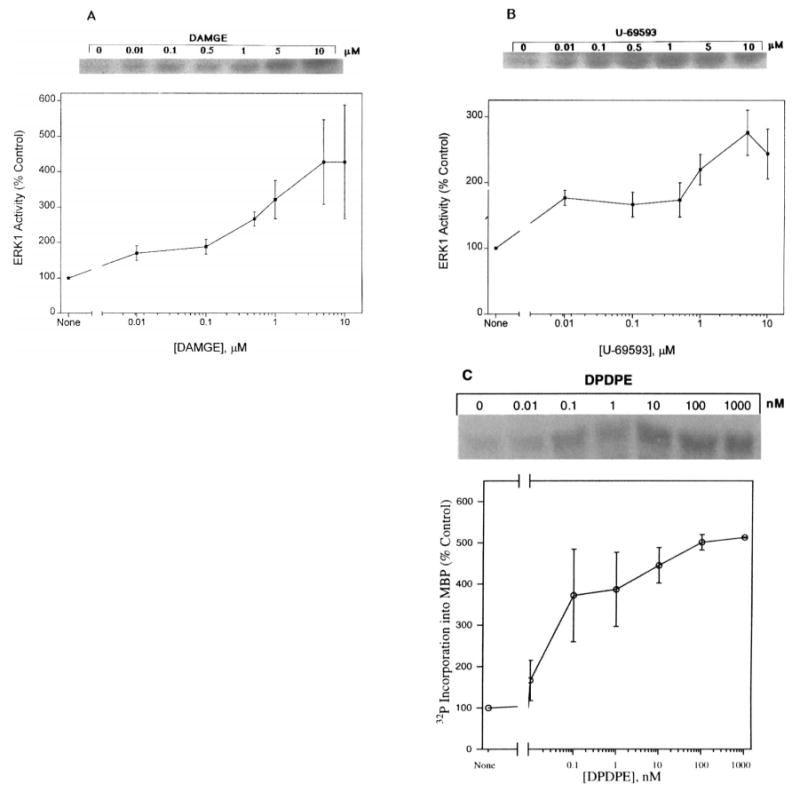
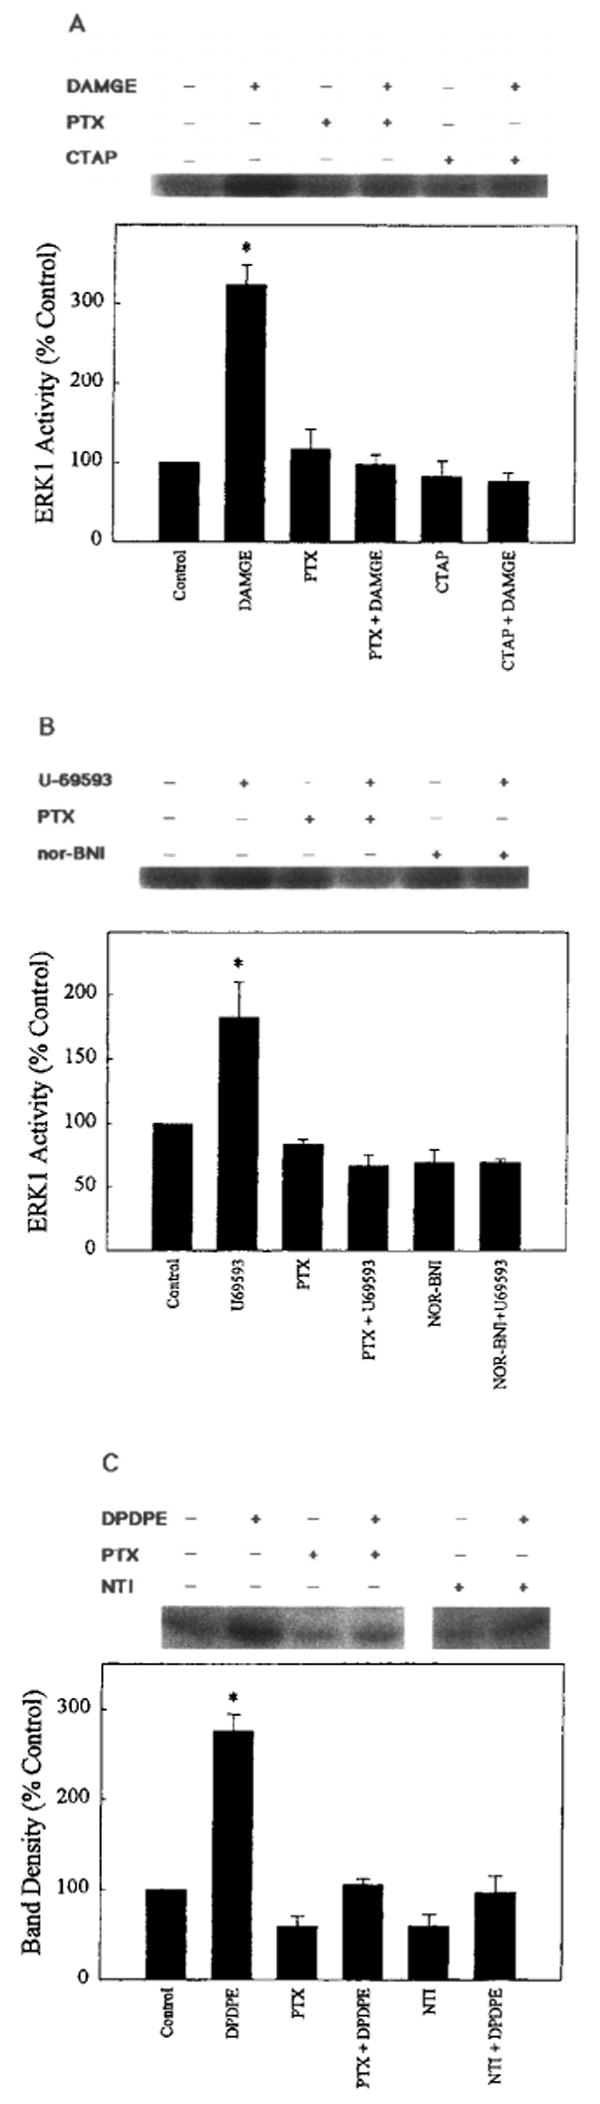
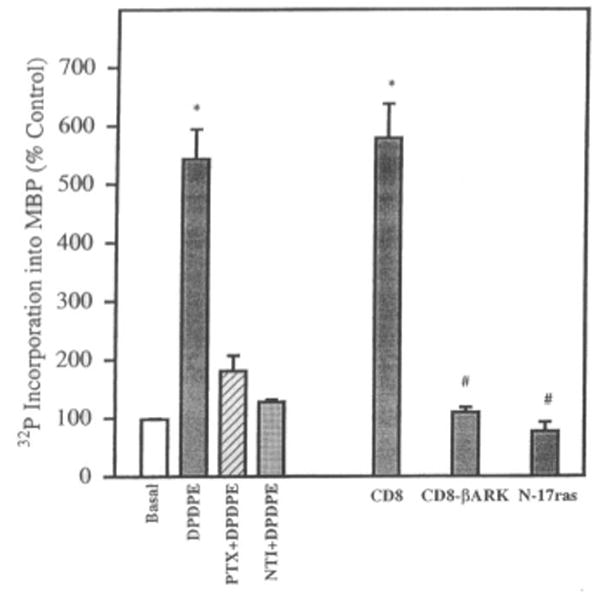
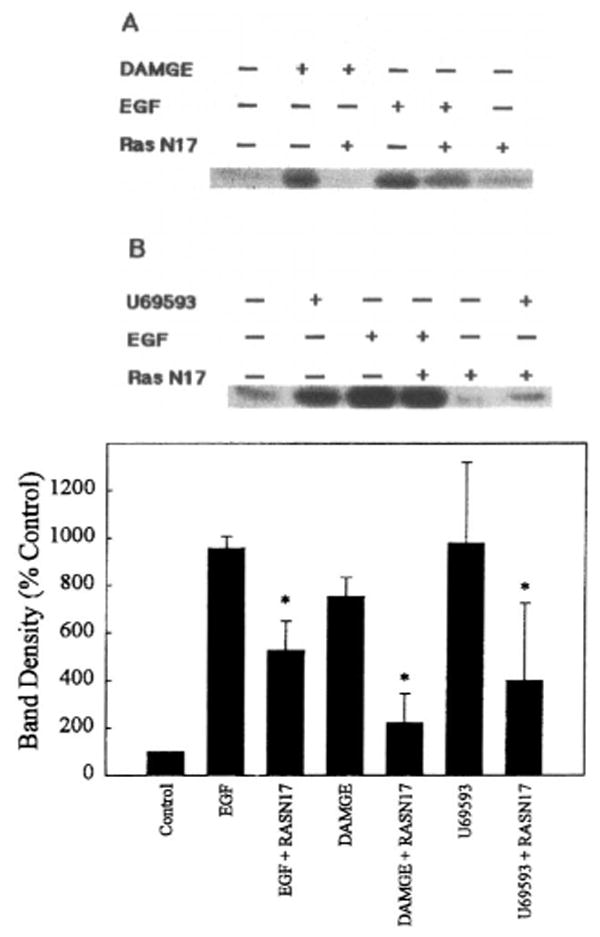
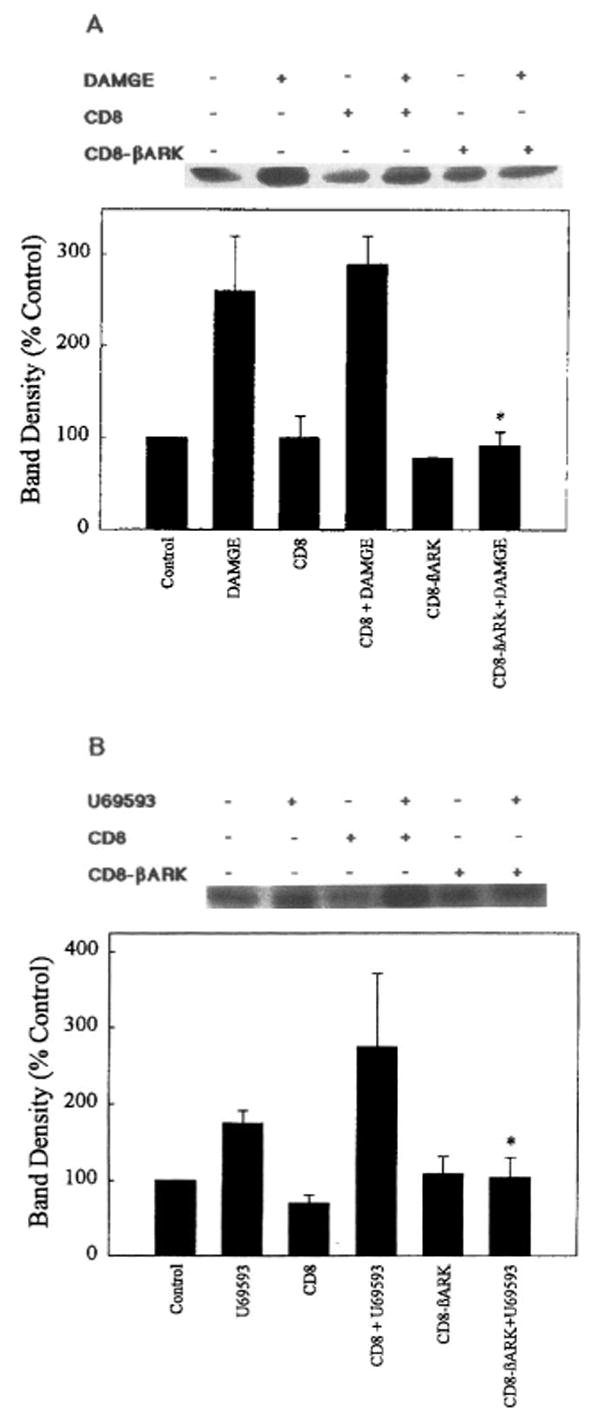
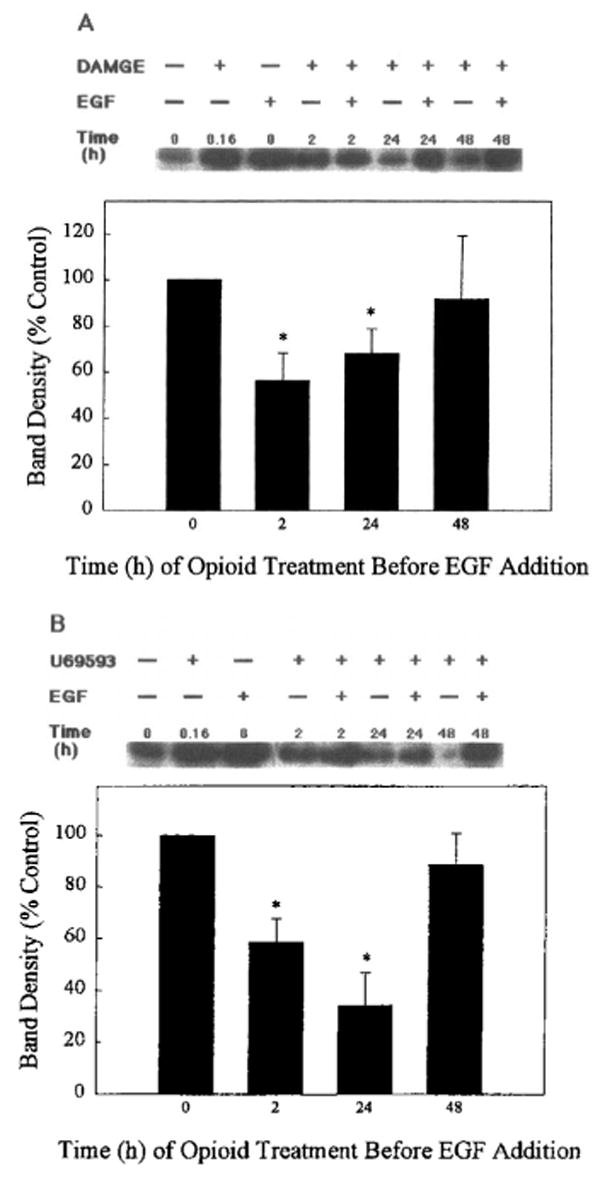
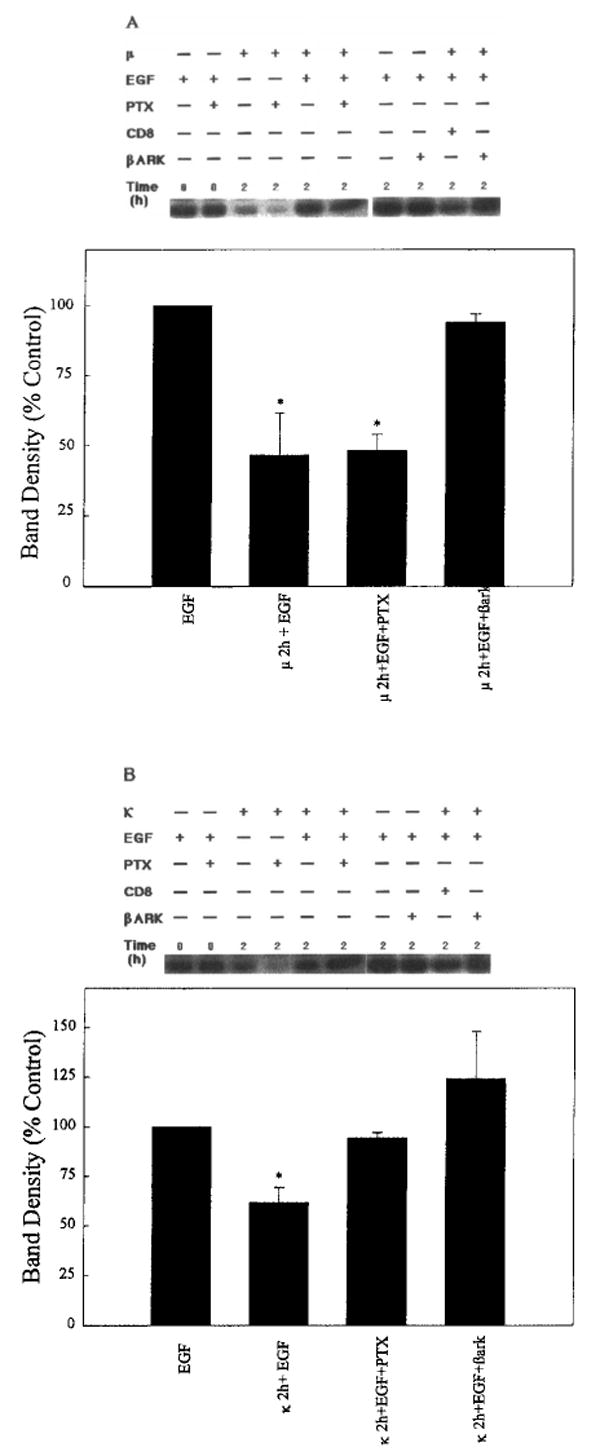
Although it is well-established that G protein-coupled receptor signaling systems can network with those of tyrosine kinase receptors by several mechanisms, the point(s) of convergence of the two pathways remains largely undelineated, particularly for opioids. Here we demonstrate that opioid agonists modulate the activity of the extracellular signal-regulated protein kinase (ERK) in African green monkey kidney COS-7 cells transiently cotransfected with mu-, delta-, or kappa-opioid receptors and ERK1- or ERK2-containing plasmids. Recombinant proteins in transfected cells were characterized by binding assay or immunoblotting. On treatment with corresponding mu- ([D-Ala2,Me-Phe4,Gly-ol5]enkephalin)-, delta- ([D-Pen2,D-Pen5]enkephalin)-, or kappa- (U69593)-selective opioid agonists, a dose-dependent, rapid stimulation of ERK1 and ERK2 activity was observed. This activation was inhibited by specific antagonists, suggesting the involvement of opioid receptors. Pretreatment of cells with pertussis toxin abolished ERK1 and ERK2 activation by agonists. Cotransfection of cells with dominant negative mutant N17-Ras or with a betagamma scavenger, CD8- beta-adrenergic receptor kinase-C, suppressed opioid stimulation of ERK1 and ERK2. When epidermal growth factor was used to activate ERK1, chronic (>2-h) opioid agonist treatment resulted in attenuation of the stimulation by the growth factor. This inhibition was blocked by the corresponding antagonists and CD8- beta-adrenergic receptor kinase-C cotransfection. These results suggest a mechanism involving Ras and betagamma subunits of Gi/o proteins in opioid agonist activation of ERK1 and ERK2, as well as opioid modulation of epidermal growth factor-induced ERK activity.


Figures

FIG. 1
FIG. 1
A: Stimulation of ERK1 activity by μ-opioid agonist. COS-7 cells transiently cotransfected with μ-OR with or without ERK1 cDNA were treated with 1 μM DAMGE for 10 min, and cell lysates were tested for ERK1 activity using the “in gel” assay as described in Experimental Procedures. A representative autoradiogram is shown with a band corresponding to ERK1 (44 kDa) and higher-molecular-mass kinases. B: Immunoblot analysis of activated ERK. In lanes 1–3 COS-7 cells were cotransfected with μ-OR and ERK1 cDNA: lane 1, nonstimulated cells; lane 2, cells treated with 1 μM DAMGE; and lane 3, serum-stimulated cells. In lanes 4–6 COS-7 cells were cotransfected with κ-OR and ERK1 cDNA: lane 4, nonstimulated cells; lane 5, cells treated with 1 μM U69593; and lane 6, serum-stimulated cells. These experiments were repeated twice.
FIG. 2
FIG. 2
Time-dependent stimulation of ERK1 and ERK2 activity by opioid agonists. COS-7 cells were cotransfected with μ- (A) or κ-OR (B) and ERK1 cDNA or δ-OR (C) and HA-ERK2 and treated with either 1 μM DAMGE (μ), 1 μM U69593 (κ), or 0.1 μM DPDPE (δ) for different intervals. Top: Representative autoradiograms show the phosphorylated MBP bands. Bottom: Quantification of ERK1 or HA-ERK2 activity. These experiments were repeated three times.
FIG. 3
FIG. 3
Concentration-dependent stimulation of ERK1 and ERK2 activity by opioid agonists. COS-7 cells were cotransfected with μ-, κ-, or δ-OR and ERK1 or ERK2 cDNA and treated with different concentrations of (A) DAMGE (μ) or (B) U69593 (κ) for 10 min and (C) DPDPE (δ) for 5 min. Top: Representative autoradiograms show the phosphorylated MBP bands. Bottom: Quantification of ERK1 and ERK2 activity. Data are mean ± SEM (bars) values from three or four experiments. Basal levels are different from all agonist-treated cell values: p < 0.05.
FIG. 4
FIG. 4
Inhibition of opioid agonist-induced ERK1 activity by PTX or antagonist. COS-7 cells were cotransfected with μ- or κ-OR and ERK1 cDNA and pretreated for 8 h with PTX (100 ng/ml) or for 1 h with (A) 1 μM CTAP (μ) before enzyme stimulation with DAMGE (100 nM), (B) 1 μM nor-BNI (κ) before enzyme stimulation with U69593 (100 nM), or (C) 1 μM naltrindole (NTI; δ) before enzyme stimulation with DPDPE (100 nM). ERK1 was stimulated with agonist for 10 min. Top: Representative autoradiograms show the phosphorylated MBP bands. Bottom: Quantification of ERK1 activity. Data are mean ± SEM (bars) values from two or three experiments. Significantly different from control and all other values: *p < 0.06.
FIG. 5
FIG. 5
HA-ERK2 activation by a δ-agonist is PTX-sensitive and is abolished by a βγ scavenger and a Ras dominant negative mutant. COS-7 cells were cotransfected with cDNAs encoding HA-ERK2 and δ-OR and as indicated with CD8, CD8-βARK-C, and the dominant negative mutant N17-Ras. Cells were exposed to 1 μM DPDPE for 5 min. PTX, cells were pretreated for 18 h with 100 ng/ml PTX; NTI, the antagonist naltrindole (1 μM) was added 2 min before DPDPE. Data are mean ± SEM (bars) values of three experiments. Significantly different from control (not treated with DPDPE): *p < 0.001. Significantly different from DPDPE-stimulated CD8 cotransfected cells: *p < 0.001.
FIG. 6
FIG. 6
ERK1 activation by opioid agonists is attenuated by a Ras dominant negative mutant. COS-7 cells were cotransfected with cDNAs encoding ERK1, μ- or κ-OR, and the dominant negative mutant N17-Ras. Cells were exposed either to EGF (100 ng/ml) for 5 min or to the corresponding opioid ligand at 1 μM for 10 min. Top: Representative autoradiograms show the phosphorylated MBP bands for (A) μ- or (B) κ-opioid ligands. Bottom: Quantification of ERK1 activity. Data are mean ± SEM (bars) values from three to five experiments. Significantly different from ERK activation in the absence of Ras: *p < 0.05.
FIG. 7
FIG. 7
Inhibition of κ- and μ-agonist-stimulated ERK1 activity by Gβγ sequestration. COS-7 cells were cotransfected with cDNA encoding (A) μ- or (B) κ-OR, ERK1, and CD8 or CD8– βARK-C. Cells were then treated with either 0.1 μM DAMGE (μ) or 0.1 μM U69593 (κ) for 10 min before determination of ERK1 activity. Top: Representative autoradiograms showing phosphorylated MBP bands. Bottom: Quantification of ERK1 activity. Data are mean ± SEM (bars) values from two or three experiments. Significantly different from ERK activation by agonist with or without CD8: *p < 0.05.
FIG. 8
FIG. 8
Time-dependent inhibition of EGF activation of ERK1 by chronic opioid agonist treatment. COS-7 cells were cotransfected with (A) μ- or (B) κ-OR and ERK1 cDNA and treated with either 1 μM DAMGE (μ) or 1 μM U69593 (κ) for different intervals, and then cells were exposed to EGF (100 ng/ml) for 5 min. Top: Representative autoradiograms show the phosphorylated MBP bands. Time signifies the interval of opioid exposure. Bottom: Quantification of ERK1 activity after pretreatment of cells with opioids for different intervals and addition of EGF for 5 min. Data are mean ± SEM (bars) values from three to five experiments. Significantly different from EGF alone: *p < 0.05.
FIG. 9
FIG. 9
Opioid inhibition of EGF-induced ERK1 activity requires the presence of Gβγ. COS-7 cells were cotransfected with (A) μ- or (B) κ-OR and ERK1 cDNA in the presence or absence of CD8 or CD8– βARK-C cDNA. Some cultures were grown in the presence of PTX (100 ng/ml) for at least 15 h before treatment with 1 μM DAMGE (μ) or 1 μM U69593 (κ) for 2 h. ERK1 activity was stimulated with EGF (100 ng/ml) for 5 min. Top: Representative autoradiograms show the phosphorylated MBP bands. Time signifies the interval of opioid exposure. Bottom: Quantification of ERK1 activity after opioid and EGF treatment. Data are mean ± SEM (bars) values from two or three experiments. Significantly different from EGF alone: *p < 0.05.

References

    1. Ahn NG, Robbins DJ, Haycock JW, Seger R, Cobb MH, Krebs EG. Identification of an activator of the microtubule-associated protein 2 kinases ERK1 and ERK2 in PC 12 cells stimulated with nerve growth factor or bradykinin. J Neurochem. 1992;59:147–156. - PubMed
    1. Avidor-Reiss T, Nevo I, Levy R, Pfeuffer T, Vogel Z. Chronic opioid treatment induces adenylyl cyclase V superactivation. J Biol Chem. 1996;271:21309–21315. - PubMed
    1. Avruch J, Zhang XF, Kyriakis JM. Raf meets ras: completing the framework of a signal transduction pathway. Trends Biochem Sci. 1994;19:279–283. - PubMed
    1. Barg J, Belcheva MM, Coscia CJ. Evidence for the implication of phosphoinositol signal transduction in μ-opioid inhibition of DNA synthesis. J Neurochem. 1992;59:1145–1152. - PMC - PubMed
    1. Barg J, Belcheva MM, Rowinski J, Coscia CJ. κ opioid agonist modulation of 3H-thymidine incorporation into DNA; evidence for the involvement of pertussis toxin-sensitive G protein-coupled phosphoinositide turnover. J Neurochem. 1993a;60:1505–1511. - PMC - PubMed

Publication types

MeSH terms

Substances