. 1998 Feb 15;18(4):1305-17.
doi: 10.1523/JNEUROSCI.18-04-01305.1998.

The synaptic basis of GABAA,slow

Affiliations

The synaptic basis of GABAA,slow

M I Banks et al. J Neurosci. .

Abstract

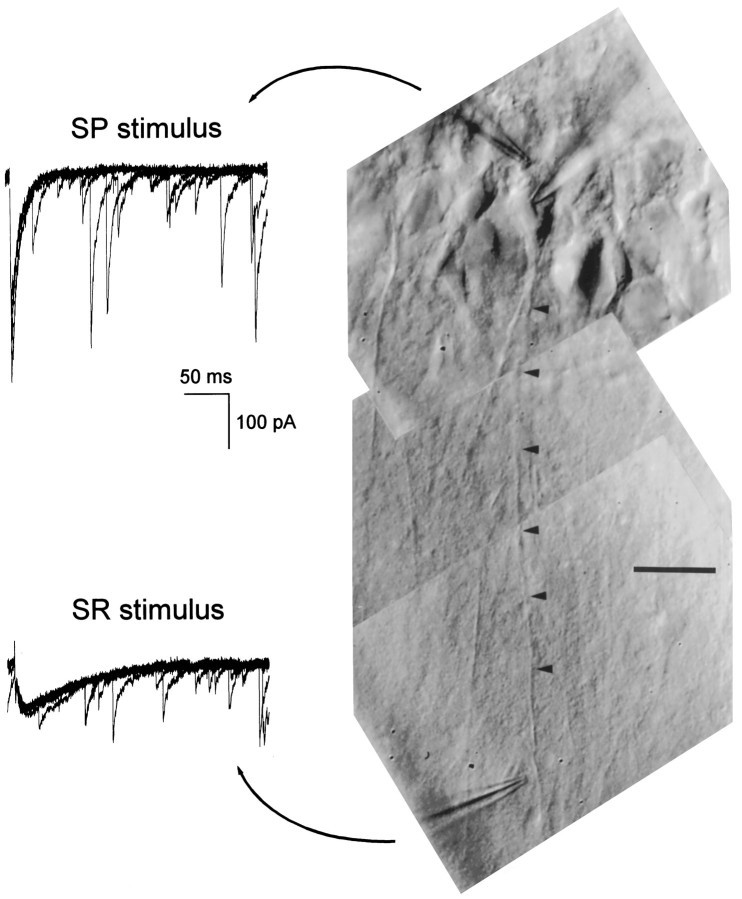
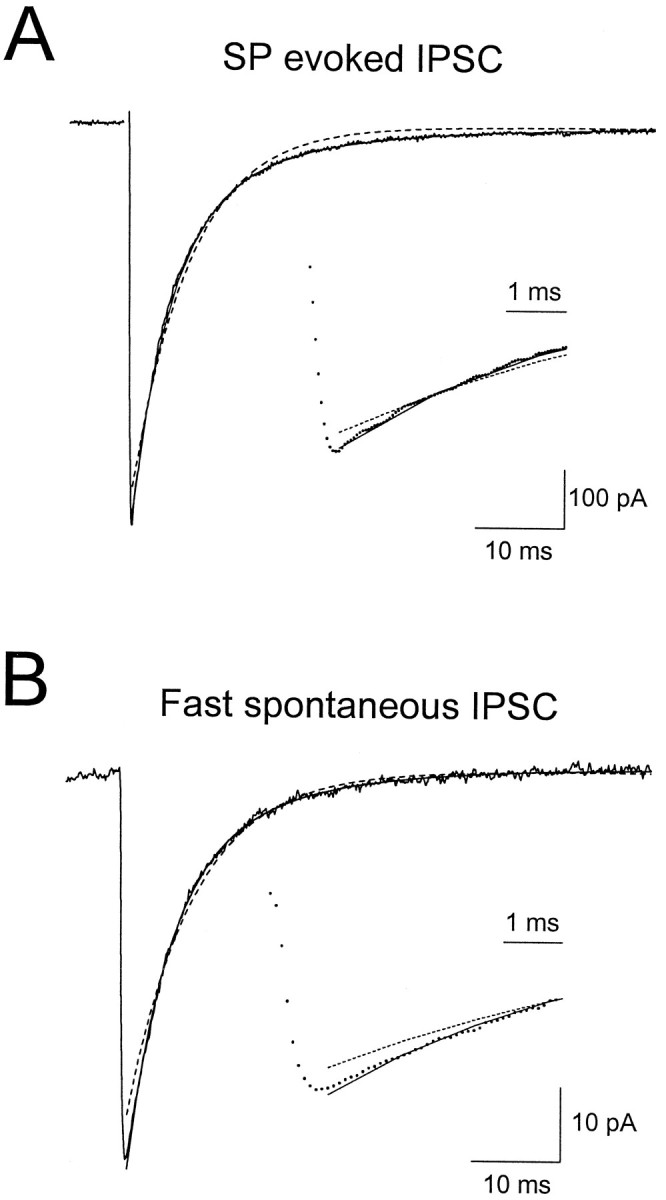
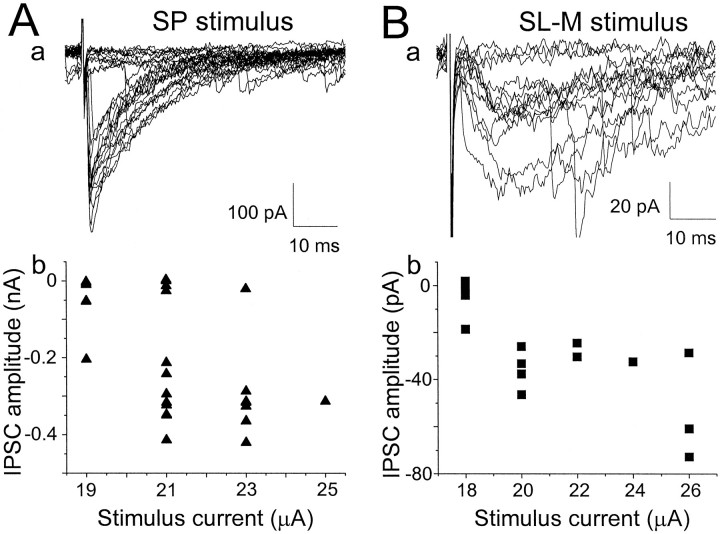
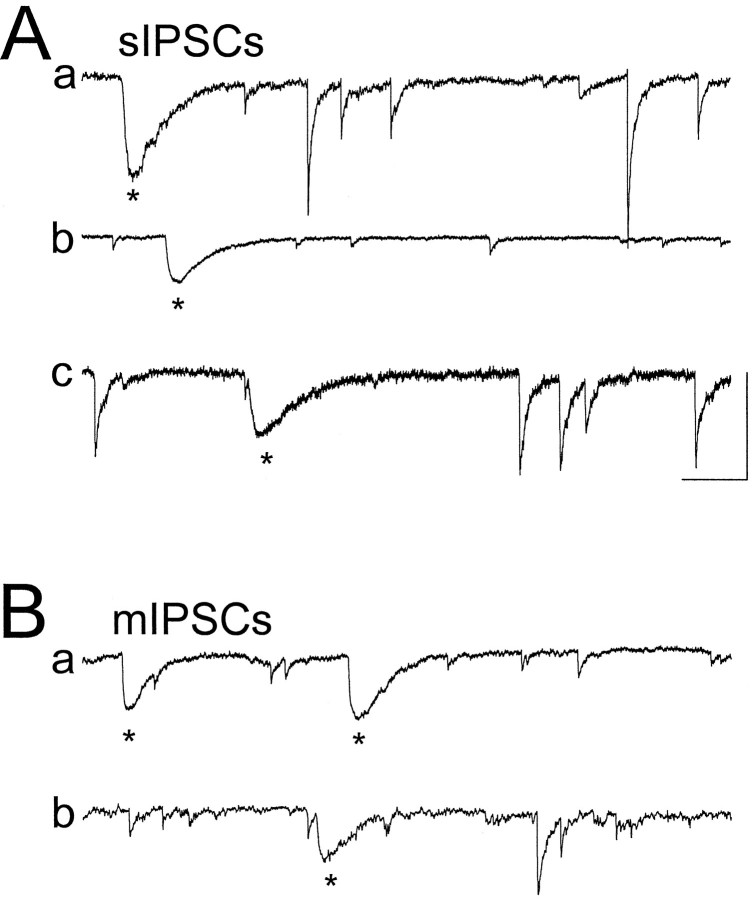
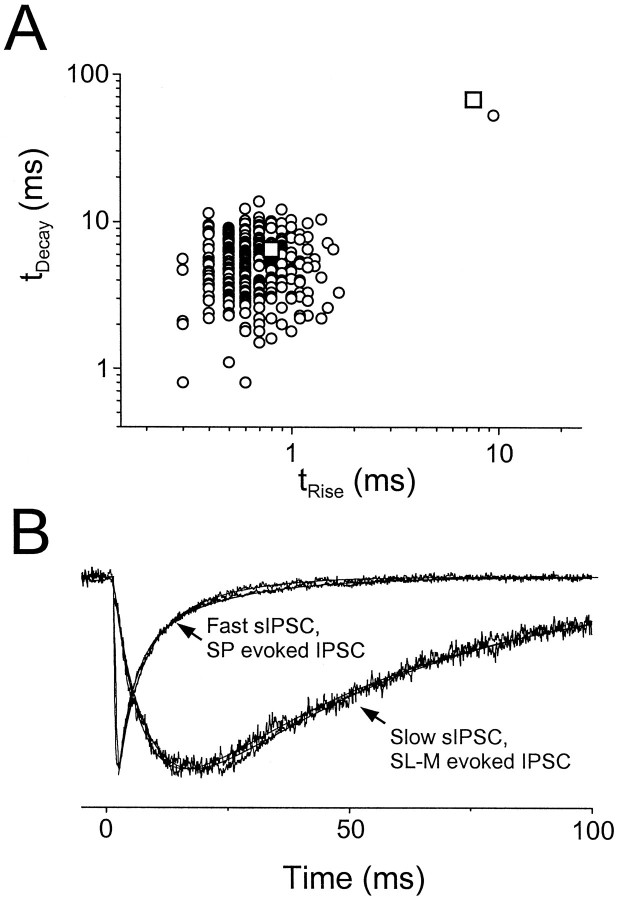
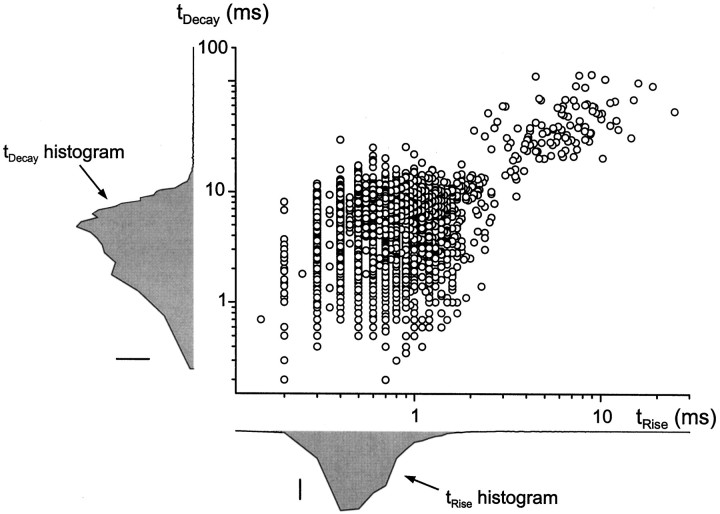
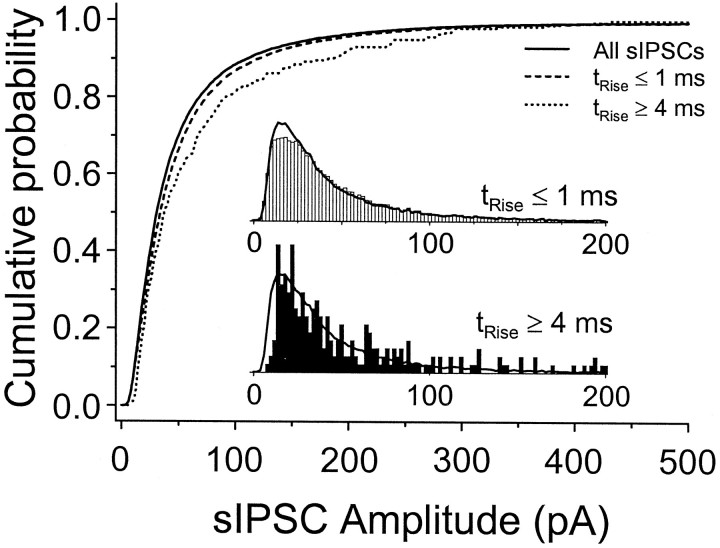
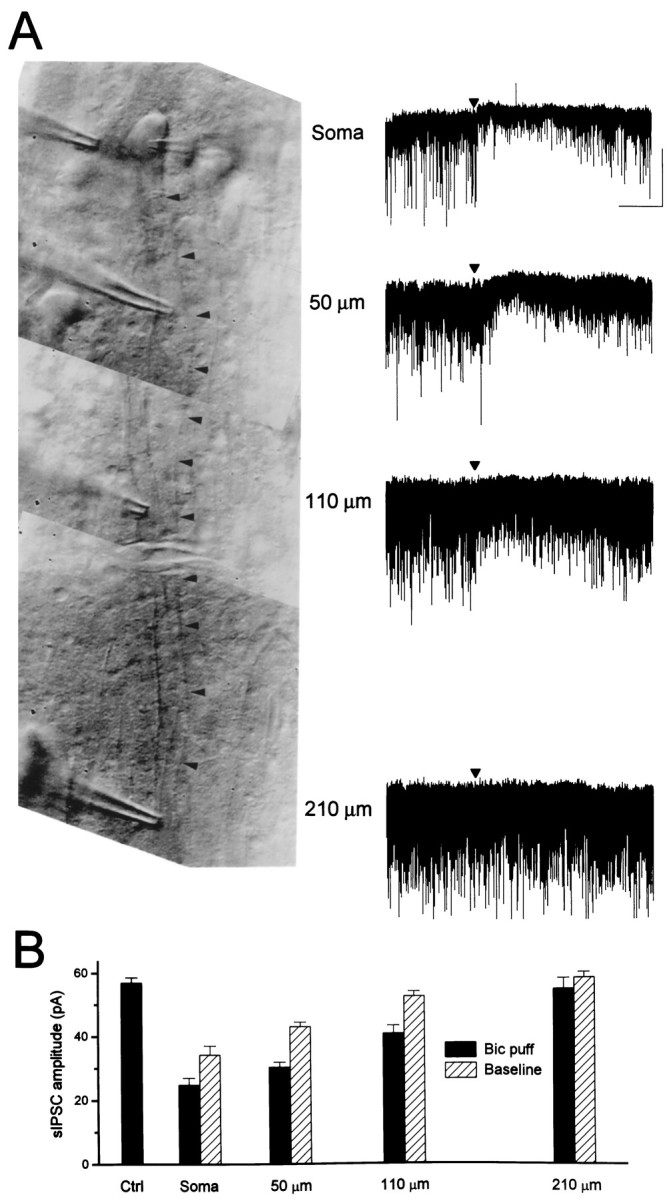
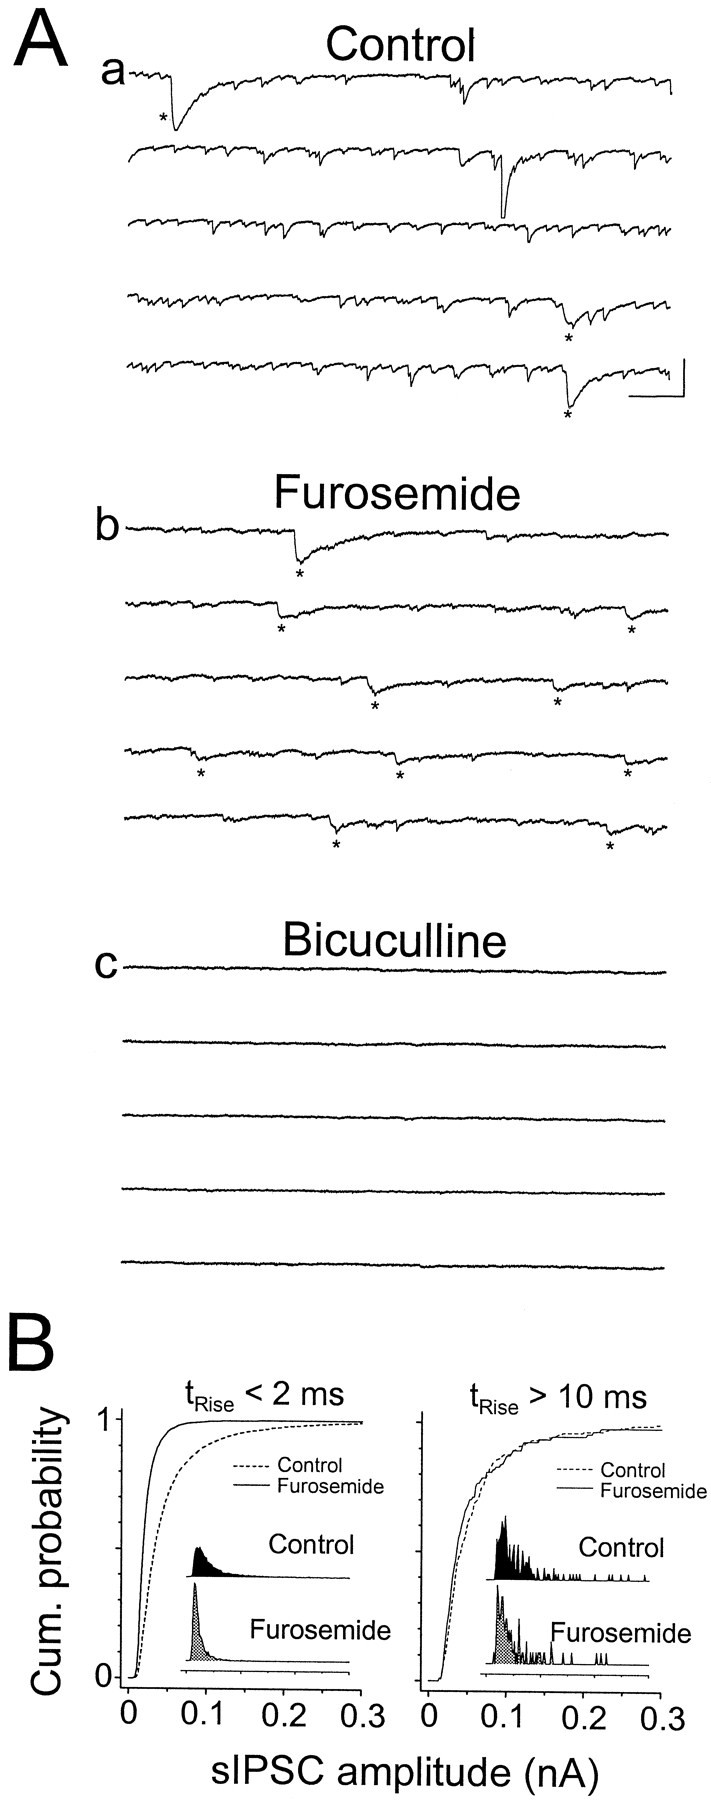
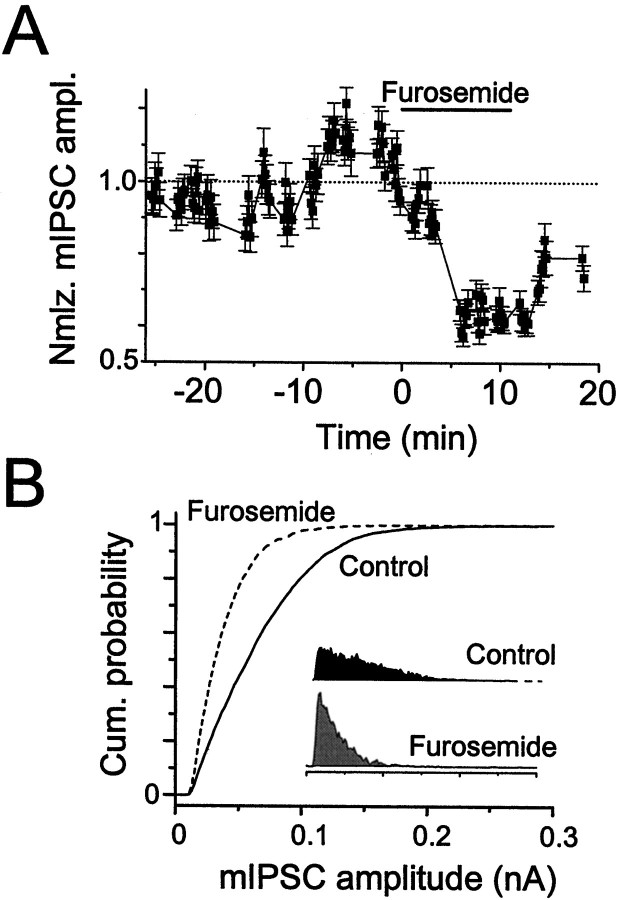
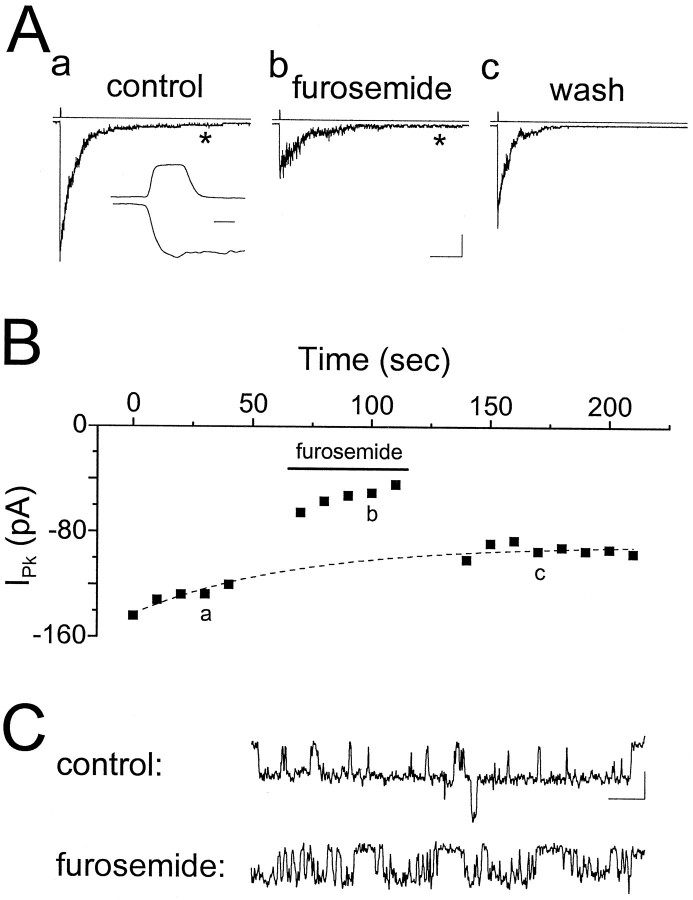
Although two kinetically distinct evoked GABAA responses (GABAA,fast and GABAA,slow) have been observed in CA1 pyramidal neurons, studies of spontaneous IPSCs (sIPSCs) in these neurons have reported only a single population of events that resemble GABAA,fast in their rise and decay kinetics. The absence of slow sIPSCs calls into question the synaptic basis of GABAA,slow. We present evidence here that both evoked responses are synaptic in origin, because two classes of minimally evoked, spontaneous and miniature IPSCs exist that correspond to GABAA,fast and GABAA,slow. Slow sIPSCs occur infrequently, suggesting that the cells underlying these events have a low spontaneous firing rate, unlike the cells giving rise to fast sIPSCs. Like evoked GABAA,fast and GABAA,slow, fast and slow sIPSCs are modulated differentially by furosemide, a subtype-specific GABAA antagonist. Furosemide blocks fast IPSCs by acting directly on the postsynaptic receptors, because it reduces the amplitude of both miniature IPSCs and the responses of excised patches to applied GABA. Thus, in the hippocampus, parallel inhibitory circuits are composed of separate populations of interneurons that contact anatomically segregated and pharmacologically distinct postsynaptic receptors.


Figures

Fig. 1.
Fig. 1.
Selective stimuli elicit GABAA,fastand GABAA,slow. Photomicrograph (right column) of a CA1 pyramidal cell in a 400 μm slice taken from a 29-d-old rat and the monosynaptic GABAA IPSCs recorded in this cell at 35°C that were evoked by stimuli in stratum pyramidale and stratum radiatum (left column). Five superimposed traces are shown for each stimulus location. The recording electrode can be seen entering the field of view from the top right and contacting the cell body. The apical dendrite of this cell is marked by the arrowheads. A stimulating electrode placed in stratum pyramidale just apical to the cell body evoked GABAA,fast (left column, top traces), which had kinetics and amplitude similar to spontaneous events recorded in this cell. A second stimulating electrode placed next to the dendrite in stratum radiatum evoked GABAA,slow (bottom left), the kinetics of which were clearly distinct from the overlying spontaneous IPSCs. Stimulus artifacts were removed off-line for clarity. Scale bar, 20 μm.
Fig. 2.
Fig. 2.
Fast IPSCs decay with biexponential kinetics. Shown are average SP-evoked (A) and spontaneous (B) IPSCs recorded in the same cell at 35°C. Both monoexponential (dashed lines) and biexponential fits (solid lines) are superimposed on the data.Insets show the data on an expanded time scale. Fit parameters are included. SP-evoked IPSC: biexponential fit, τdec1,2 = 3.6 msec (63%) and 11.3 msec; monoexponential fit, τdec = 6.5 msec. Fast sIPSC: biexponential fit, τdec1,2 = 4.5 msec (71%) and 13.6 msec; monoexponential fit, τdecay = 7.5 msec. In both cases the second decay component significantly improved the fit (p< 0.01, using the F test).
Fig. 3.
Fig. 3.
Minimally evoked GABAA,fast and GABAA,slow IPSCs. Shown are GABAA IPSCs recorded at 35°C in the same cell in response to stimuli in stratum pyramidale (A, a) and stratum lacunosum-moleculare (B, a). In both cases, small increases in stimulus intensity elicited all-or-none responses (A, b; B, b). Note the difference in amplitude scale in A, a versus B, a. The kinetic parameters for exponential fits to the average minimally evoked IPSCs in this cell were SP, τdec1,2 = 2.72 msec (25%) and 11.7 msec; SL-M eIPSC, τrise = 5.50 msec and τdecay = 43.0 msec. For SP minimally evoked IPSCs, the average fit parameters in seven cells were τdec1,2 = 3.37 ± 0.53 msec (38 ± 7%) and 13.0 ± 0.9 msec. ForSL-M, average parameters in five cells were τrise = 5.15 ± 0.26 msec and τdecay = 53.8 ± 8.4 msec.
Fig. 4.
Fig. 4.
Kinetic heterogeneity of spontaneous and miniature IPSCs. Shown are sIPSCs (A) and mIPSCs (B) recorded at 35°C in five different cells. sIPSCs with slow kinetics are marked by asterisks. Calibration: 100 msec, 200 pA.
Fig. 5.
Fig. 5.
Evoked and spontaneous IPSCs have similar kinetics. A, Scatterplot oftdecay versustrise for 321 sIPSCs (open circles) recorded in a cell at 35°C. The single slow sIPSC is the same event that is shown in Figure 4A(second trace). The other 320 sIPSCs were recorded 30 sec before and 30 sec after this event. Also shown are the kinetic parameters for the IPSCs evoked by SP and SL-M stimulation (open squares) shown in B. B, Averaged and normalized fast sIPSC, SP-evoked IPSC, slow sIPSC, and SL-M-evoked IPSC recorded in the same cell as in A. Fit parameters include the following: fast sIPSC, trise = 0.4 msec and τdec1,2 = 3.5 msec (56%) and 13.7 msec; SP-evoked IPSC, trise = 0.8 msec and τdec1,2 = 3.9 msec (62%) and 18.5 msec; slow sIPSC, τrise = 7.2 msec and τdecay = 52.2 msec; SL-M-evoked IPSC, τrise = 6.0 msec and τdecay = 53.9 msec.
Fig. 6.
Fig. 6.
Two kinetic classes of sIPSCs. A scatterplot oftdecay versustrise is shown for >5000 sIPSCs recorded at 35°C in six different cells with high rates of slow sIPSCs. Most of the sIPSCs had rapid rise and fall kinetics and are clustered in thelower left quadrant of the plot (see histograms atleft and bottom left). Approximately 2% of the events had tdecay > 20 msec andtrise > 2.5 msec. Within these two groups there was little correlation between tdecayand trise (fast,r2 = 0.0265; slow,r2 = 0.137). Scale bars:tdecay histogram, 100 counts;trise histogram, 250 counts.
Fig. 7.
Fig. 7.
Amplitude distributions of fast- and slow-rising sIPSCs. Shown are cumulative amplitude distributions for the fastest rising (trise ≤ 1 msec; dashed line) and slowest rising (trise ≥ 4 msec; dotted line) sIPSCs of >30,000 sIPSCs recorded at 35°C in six cells. The distribution for the entire population of sIPSCs (solid line) is plotted for reference. Also shown are amplitude histograms for the fast-rising (top inset, open bars) and slow-rising (bottom inset, filled bars) sIPSCs. The histogram for the entire population appears as a solid line in both insets. Histograms were normalized so that their total area = 1.
Fig. 8.
Fig. 8.
Fast sIPSCs arise close to the soma.A, Composite photomicrograph (left) of a CA1 pyramidal cell showing the four positions at which bicuculline was puffed onto the cell body or apical dendrite (marked byarrowheads). The recording pipette can be seen entering the field of view from the right. Sample traces are illustrated for each puffer pipette position (right column). The time of the puff is indicated by thearrowhead; recording was at 35°C. Calibration: 2 sec, 100 pA. B, Summary data for the cell illustrated inA. Shown are sIPSC amplitudes without the puffer pipette near the cell (Ctrl) and averaged 2 sec after the bicuculline puff at four positions relative to the cell (black bars). Because of leakage from the puffer pipette, the baseline sIPSC amplitude was reduced in a spatially restricted manner (striped bars) also, similar to the effect on sIPSCs immediately after the puff.
Fig. 9.
Fig. 9.
Furosemide selectively blocks fast sIPSCs.A, sIPSCs recorded from a cell at 24°C in control solution (a), 0.6 mm furosemide (b), and 0.6 mm furosemide plus 10 μm bicuculline (c). The effect of bicuculline was reversible for both the fast and slow events. Traces are consecutive within each panel. Slow sIPSCs are indicated withasterisks. Calibration: 200 msec, 200 pA.B, Cumulative amplitude distributions for fast-rising sIPSCs (left) and slow-rising sIPSCs (right) in control solution (dashed lines) and 0.6 mm furosemide (solid lines). Insets show raw amplitude histograms, normalized by their area.
Fig. 10.
Fig. 10.
Furosemide blocks miniature IPSCs. Shown is a time series plot of normalized mIPSC amplitude (A) and cumulative amplitude distribution (B) for a cell exposed to 0.6 mmfurosemide in the presence of 1 μm TTX.Insets show raw amplitude histograms, normalized by their area. Furosemide reduced mIPSC amplitude, with a small effect on mIPSC frequency (data not shown). Recording was at 35°C.
Fig. 11.
Fig. 11.
Furosemide blocks excised patch responses.A, Responses recorded from an outside-out patch excised from the cell body of a CA1 pyramidal cell in response to 1 mm GABA in the absence and presence of furosemide (0.6 mm). Asterisks in a andb refer to the data in C. Calibration: 100 msec, 25 pA. Inset, 1 msec. B, Time series plot of the peak responses for the experiment inA. Furosemide rapidly and reversibly blocked the response by 48%. The dotted line is an exponential fit to the baseline to compute accurately the percentage of block in the presence of rundown. a, b, and c refer to the traces in A. C, Data from the tails of the responses in B are replotted on an expanded scale to show single channel behavior. Calibration: 10 msec, 2 pA.

References

    1. Ashwood TJ, Lancaster B, Wheal HV. In vivo and in vitro studies on putative interneurones in the rat hippocampus: possible mediators of feed-forward inhibition. Brain Res. 1984;293:279–291. - PubMed
    1. Banks MI, Pearce RA. Fast and slow spontaneous IPSCs in CA1 pyramidal cells. Soc Neurosci Abstr. 1996;22:810.
    1. Barbour B, Keller BU, Llano I, Marty A. Prolonged presence of glutamate during excitatory synaptic transmission to cerebellar Purkinje cells. Neuron. 1994;12:1331–1343. - PubMed
    1. Buhl EH, Halasy K, Somogyi P. Diverse sources of hippocampal unitary inhibitory postsynaptic potentials and the number of synaptic release sites. Nature. 1994a;368:823–827. - PubMed
    1. Buhl EH, Han ZS, Lorinczi Z, Stezhka VV, Karnup SV, Somogyi P. Physiological properties of anatomically identified axo-axonic cells in the rat hippocampus. J Neurophysiol. 1994b;71:1289–1307. - PubMed

Publication types

LinkOut - more resources