Immunofluorescence microscopy and flow cytometry characterization of chemical induction of latent Epstein-Barr virus
- PMID: 9455888
- PMCID: PMC121399
- DOI: 10.1128/CDLI.5.1.91-97.1998
Immunofluorescence microscopy and flow cytometry characterization of chemical induction of latent Epstein-Barr virus
Abstract
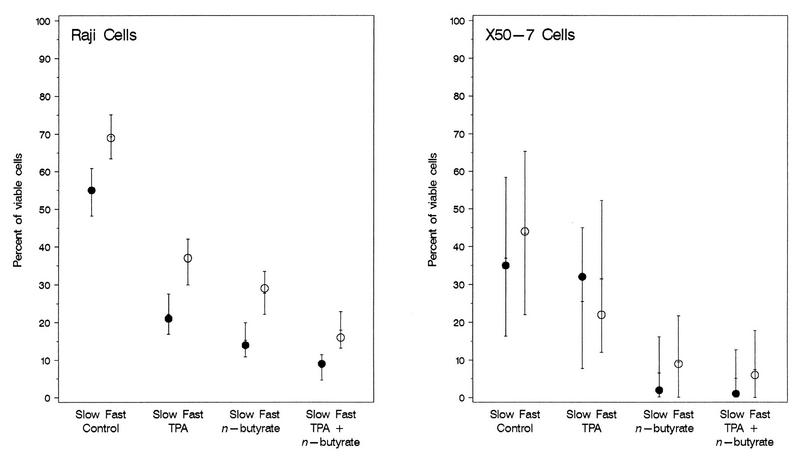
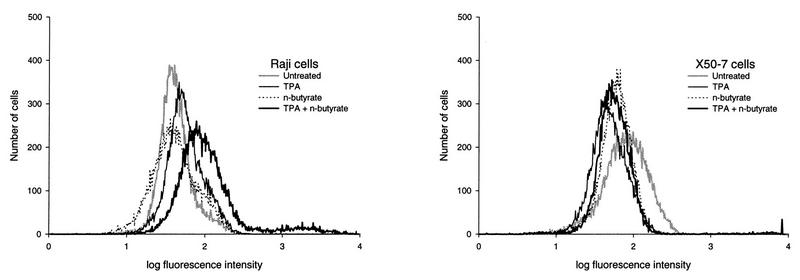
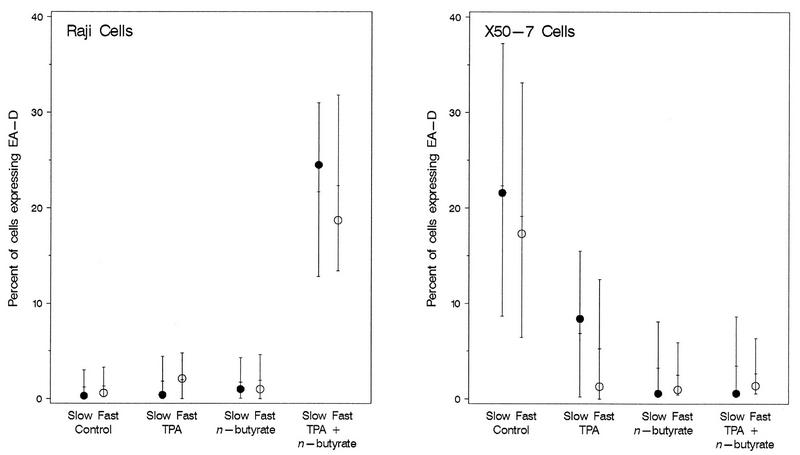
The effects of chemical induction of latent Epstein-Barr virus (EBV) with 12-O-tetradecanoyl phorbol-13-acetate (TPA) and n-butyrate on cell viability and induction of latent EBV in Raji and X50-7 B lymphocytes, indicated by expression of the diffuse component of the EBV early antigen (EA-D), were measured by visual immunofluorescence microscopy (of both viable and nonviable cells) and fluorescence-activated cell sorter (FACS) flow cytometry (of viable cells only). Cell viability at 4 days decreased moderately for treated Raji cells (9 to 37%, compared to 55 to 69% for untreated cells) and markedly for X50-7 cells (1-32% compared to 35-44% in untreated cells). The highest EA-D levels in viable cells occurred in Raji cells treated with both TPA and n-butyrate and untreated X50-7 cells. TPA and n-butyrate acted synergistically to induce latent EBV, resulting in increased levels of EA-D production in Raji cells and cell death in X50-7 cells. Methodological differences including the ability to detect antigen in only viable cells by FACS flow cytometry accounted for the higher levels of EA-D observed by FACS analysis compared to the levels observed by immunofluorescence microscopy. FACS analysis may be more objective and reproducible than immunofluorescence microscopy for the detection of EBV induction and also permits viral protein expression to be distinguished in the subpopulation of viable cells.
Figures
Similar articles
-
Cocaine potentiates the switch between latency and replication of Epstein-Barr virus in Raji cells.Biochem Biophys Res Commun. 1999 Oct 14;264(1):33-6. doi: 10.1006/bbrc.1999.1447. Biochem Biophys Res Commun. 1999. PMID: 10527836
-
Similarity of Epstein-Barr virus early polypeptides induced by various tumor promoters.Cancer Lett. 1982 May-Jun;16(1):19-23. doi: 10.1016/0304-3835(82)90086-6. Cancer Lett. 1982. PMID: 6288232
-
Induction of virus enzymes by phorbol esters and n-butyrate in Epstein-Barr virus genome-carrying Raji cells.Cancer Res. 1987 Aug 15;47(16):4407-12. Cancer Res. 1987. PMID: 3038311
-
Effects of n-butyrate and phorbol ester (TPA) on induction of Epstein-Barr virus antigens and cell differentiation.Arch Virol. 1984;81(3-4):223-37. doi: 10.1007/BF01309995. Arch Virol. 1984. PMID: 6089703
-
Epstein--Barr virus post-transplant lymphoproliferative disease and virus-specific therapy: pharmacological re-activation of viral target genes with arginine butyrate.Transpl Infect Dis. 2001 Sep;3(3):177-85. doi: 10.1034/j.1399-3062.2001.003003177.x. Transpl Infect Dis. 2001. PMID: 11493400 Review.
Cited by
-
Mechanosensitive mTORC1 signaling maintains lymphatic valves.J Cell Biol. 2023 Jun 5;222(6):e202207049. doi: 10.1083/jcb.202207049. Epub 2023 Apr 10. J Cell Biol. 2023. PMID: 37036444 Free PMC article.
-
Sequential use of paraformaldehyde and methanol as optimal conditions for the direct quantification of ZEBRA and rta antigens by flow cytometry.Clin Diagn Lab Immunol. 2000 Mar;7(2):206-11. doi: 10.1128/CDLI.7.2.206-211.2000. Clin Diagn Lab Immunol. 2000. PMID: 10702494 Free PMC article.
-
Epstein-Barr virus encoded dUTPase containing exosomes modulate innate and adaptive immune responses in human dendritic cells and peripheral blood mononuclear cells.PLoS One. 2013 Jul 22;8(7):e69827. doi: 10.1371/journal.pone.0069827. Print 2013. PLoS One. 2013. PMID: 23894549 Free PMC article.
-
Applications of flow cytometry in plant pathology for genome size determination, detection and physiological status.Mol Plant Pathol. 2011 Oct;12(8):815-28. doi: 10.1111/j.1364-3703.2011.00711.x. Epub 2011 Mar 29. Mol Plant Pathol. 2011. PMID: 21726378 Free PMC article. Review.
-
Clinical relevance of direct quantification of pp65 antigenemia using flow cytometry in solid organ and stem cell transplant recipients.J Clin Microbiol. 2000 Sep;38(9):3143-9. doi: 10.1128/JCM.38.9.3143-3149.2000. J Clin Microbiol. 2000. PMID: 10970347 Free PMC article.
References
-
- Anisimová E, Prachová K, Roubal J, Vonka V. Effects of n-butyrate and phorbol ester (TPA) on induction of Epstein-Barr virus antigens and cell differentiation. Arch Virol. 1984;81:223–237. - PubMed
-
- Anisimová E, Saemundsen A K, Roubal J, Vonka V, Klein G. Effects of n-butyrate on Epstein-Barr virus-carrying lymphoma lines. J Gen Virol. 1982;58:163–171. - PubMed
-
- Baer R, Bankier A T, Biggin M D, Deininger P L, Farrell P J, Gibson T J, Hatfull G, Hudson G S, Satchwell S C, Séguin C, Tuffnell P S, Barrell B G. DNA sequence and expression of the B95-8 Epstein-Barr virus genome. Nature. 1984;310:207–211. - PubMed
-
- Bister K, Yamamoto N, zur Hausen H. Differential inducibility of Epstein-Barr virus in cloned, non-producer Raji cells. Int J Cancer. 1979;23:818–825. - PubMed
Publication types
MeSH terms
Substances
Grants and funding
LinkOut - more resources
Full Text Sources