

Bacillus subtilis cell cycle as studied by fluorescence microscopy: constancy of cell length at initiation of DNA replication and evidence for active nucleoid partitioning
- PMID: 9457856
- PMCID: PMC106920
- DOI: 10.1128/JB.180.3.547-555.1998
Bacillus subtilis cell cycle as studied by fluorescence microscopy: constancy of cell length at initiation of DNA replication and evidence for active nucleoid partitioning
Abstract
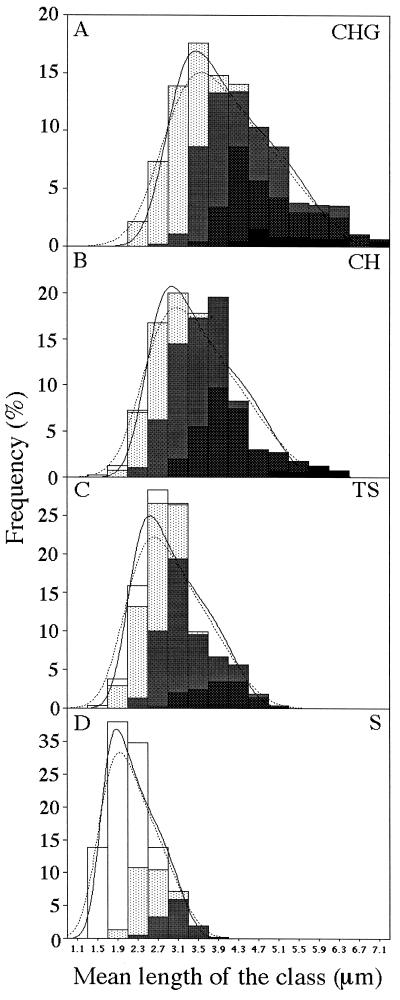
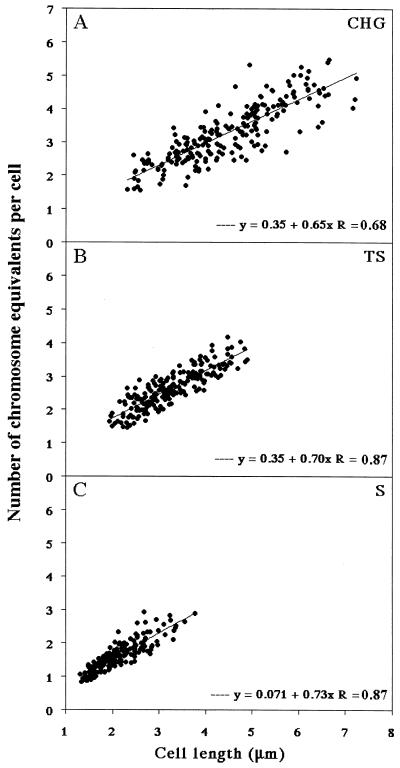
Fluorescence microscopic methods have been used to characterize the cell cycle of Bacillus subtilis at four different growth rates. The data obtained have been used to derive models for cell cycle progression. Like that of Escherichia coli, the period required by B. subtilis for chromosome replication at 37 degrees C was found to be fairly constant (although a little longer, at about 55 min), as was the cell mass at initiation of DNA replication. The cell cycle of B. subtilis differed from that of E. coli in that changes in growth rate affected the average cell length but not the width and also in the relative variability of period between termination of DNA replication and septation. Overall movement of the nucleoid was found to occur smoothly, as in E. coli, but other aspects of nucleoid behavior were consistent with an underlying active partitioning machinery. The models for cell cycle progression in B. subtilis should facilitate the interpretation of data obtained from the recently introduced cytological methods for imaging the assembly and movement of proteins involved in cell cycle dynamics.
Figures


Similar articles
-
Dynamic movement of the ParA-like Soj protein of B. subtilis and its dual role in nucleoid organization and developmental regulation.Mol Cell. 1999 Nov;4(5):673-82. doi: 10.1016/s1097-2765(00)80378-0. Mol Cell. 1999. PMID: 10619015
-
Cell division of cycle of Bacillus subtilis: evidence of variability in period D.J Bacteriol. 1980 Apr;142(1):254-61. doi: 10.1128/jb.142.1.254-261.1980. J Bacteriol. 1980. PMID: 6768710 Free PMC article.
-
Dynamic, mitotic-like behavior of a bacterial protein required for accurate chromosome partitioning.Genes Dev. 1997 May 1;11(9):1160-8. doi: 10.1101/gad.11.9.1160. Genes Dev. 1997. PMID: 9159397
-
Coordinating DNA replication with cell division: lessons from outgrowing spores.Biochimie. 2001 Jan;83(1):75-81. doi: 10.1016/s0300-9084(00)01220-7. Biochimie. 2001. PMID: 11254978 Review.
-
Regulation of initiation of Bacillus subtilis chromosome replication.Plasmid. 1999 Jan;41(1):17-29. doi: 10.1006/plas.1998.1381. Plasmid. 1999. PMID: 9887303 Review.
Cited by
-
Growth rate and cell size: a re-examination of the growth law.Curr Opin Microbiol. 2015 Apr;24:96-103. doi: 10.1016/j.mib.2015.01.011. Epub 2015 Feb 5. Curr Opin Microbiol. 2015. PMID: 25662920 Free PMC article. Review.
-
Elasticity and biochemistry of growth relate replication rate to cell length and cross-link density in rod-shaped bacteria.Biophys J. 2013 Jun 18;104(12):2607-11. doi: 10.1016/j.bpj.2013.04.028. Biophys J. 2013. PMID: 23790368 Free PMC article.
-
Pyruvate kinase, a metabolic sensor powering glycolysis, drives the metabolic control of DNA replication.BMC Biol. 2022 Apr 13;20(1):87. doi: 10.1186/s12915-022-01278-3. BMC Biol. 2022. PMID: 35418203 Free PMC article.
-
The Replicative DnaE Polymerase of Bacillus subtilis Recruits the Glycolytic Pyruvate Kinase (PykA) When Bound to Primed DNA Templates.Life (Basel). 2023 Apr 7;13(4):965. doi: 10.3390/life13040965. Life (Basel). 2023. PMID: 37109494 Free PMC article.
-
Multiple regulatory systems coordinate DNA replication with cell growth in Bacillus subtilis.PLoS Genet. 2014 Oct 23;10(10):e1004731. doi: 10.1371/journal.pgen.1004731. eCollection 2014 Oct. PLoS Genet. 2014. PMID: 25340815 Free PMC article.
References
-
- Begg K J, Donachie W D. Experiments on chromosome separation and positioning in Escherichia coli. New Biol. 1991;3:475–486. - PubMed
-
- Burton P, Holland I B. Two pathways of division inhibition in UV-irradiated E. coli. Mol Gen Genet. 1983;189:128–132. - PubMed
-
- Collins J F, Richmond M H. Rate of growth of Bacillus cereus between divisions. J Gen Microbiol. 1962;28:15–23. - PubMed
-
- Donachie W D. Relationship between cell size and time of initiation of DNA replication. Nature. 1968;219:1077–1079. - PubMed
Publication types
MeSH terms
Substances
LinkOut - more resources
Full Text Sources
