. 1998 Feb 16;187(4):487-96.
doi: 10.1084/jem.187.4.487.

Inhibition of apoptosis in chlamydia-infected cells: blockade of mitochondrial cytochrome c release and caspase activation

Affiliations

Inhibition of apoptosis in chlamydia-infected cells: blockade of mitochondrial cytochrome c release and caspase activation

T Fan et al. J Exp Med. .

Abstract

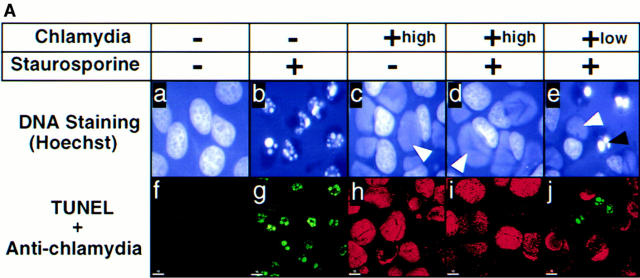
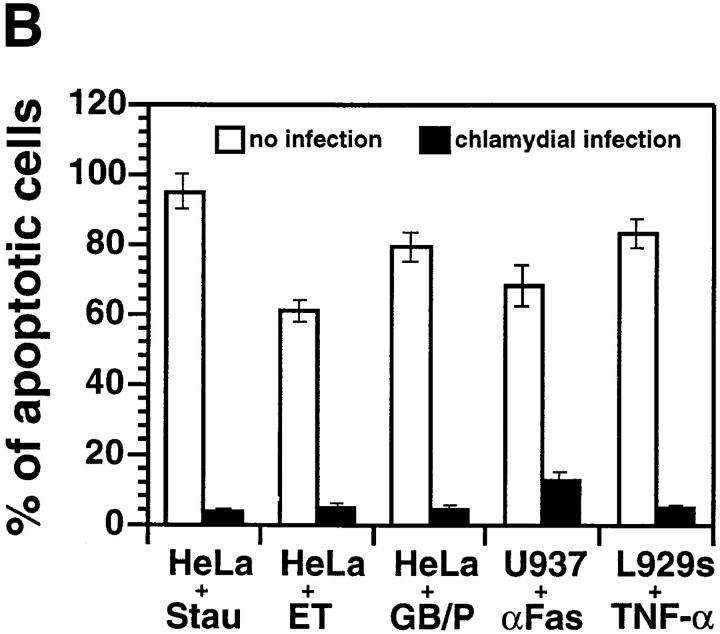
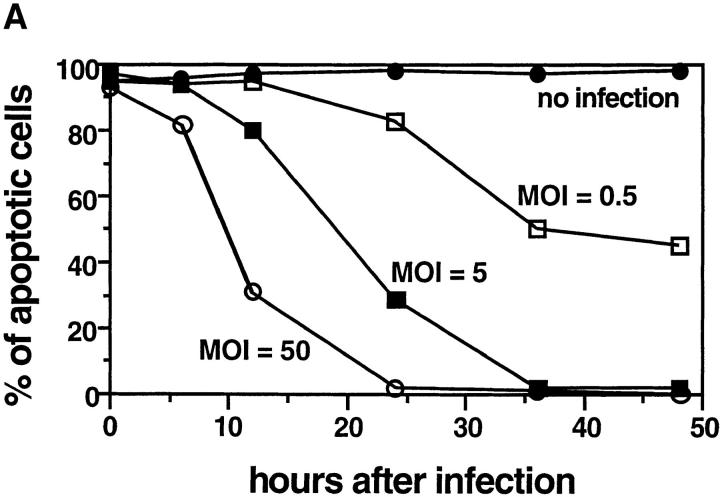
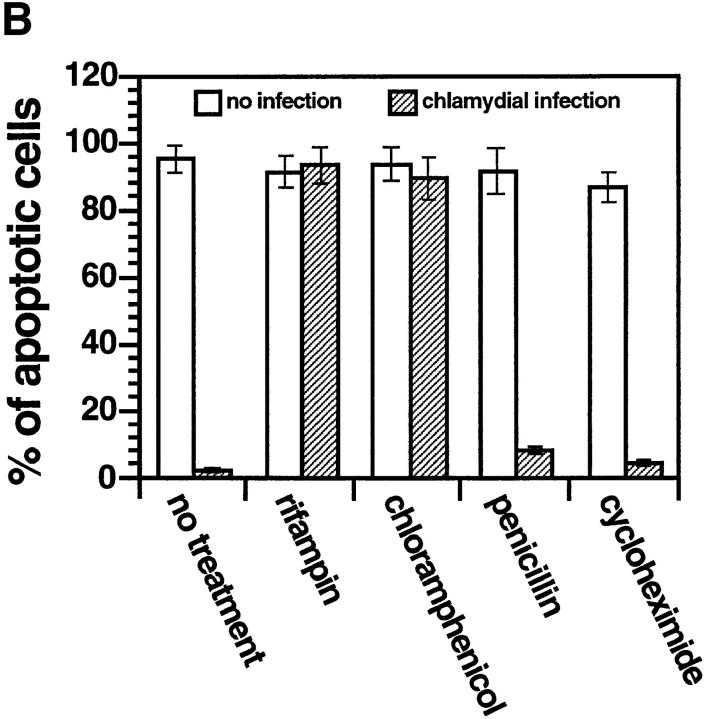
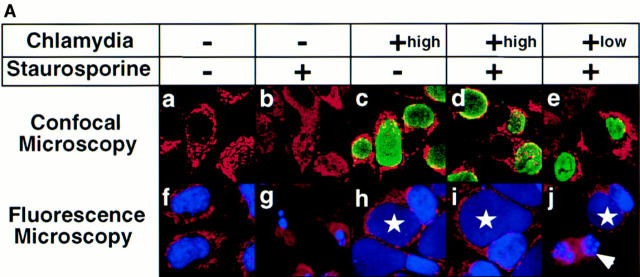
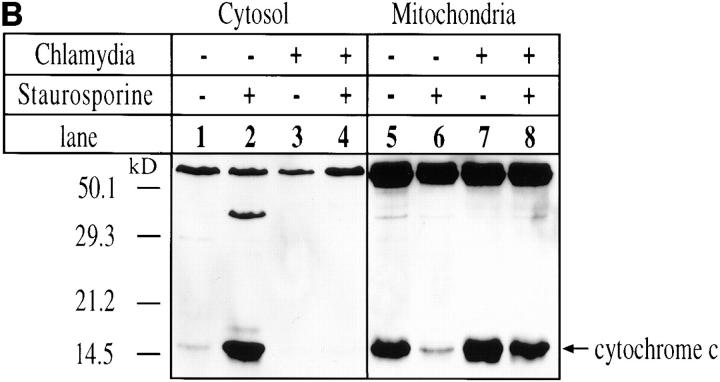
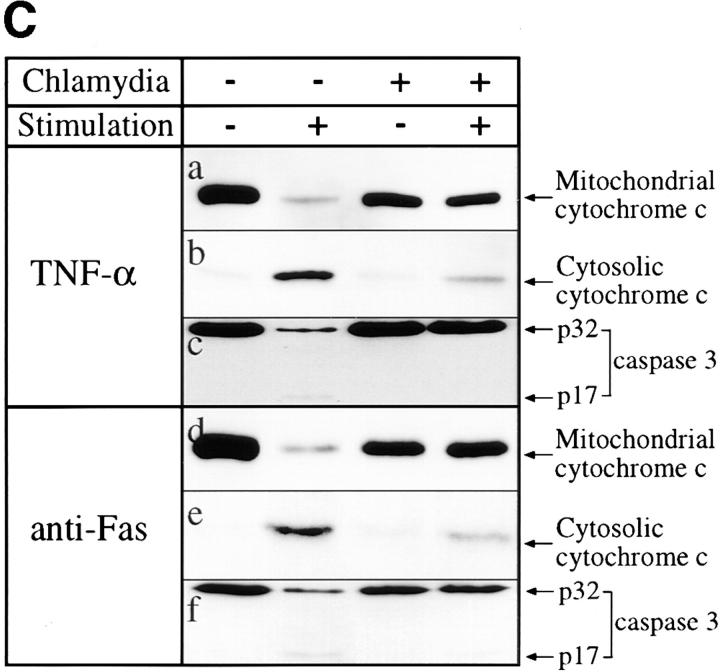
We report that chlamydiae, which are obligate intracellular bacterial pathogens, possess a novel antiapoptotic mechanism. Chlamydia-infected host cells are profoundly resistant to apoptosis induced by a wide spectrum of proapoptotic stimuli including the kinase inhibitor staurosporine, the DNA-damaging agent etoposide, and several immunological apoptosis-inducing molecules such as tumor necrosis factor-alpha, Fas antibody, and granzyme B/perforin. The antiapoptotic activity was dependent on chlamydial but not host protein synthesis. These observations suggest that chlamydia may encode factors that interrupt many different host cell apoptotic pathways. We found that activation of the downstream caspase 3 and cleavage of poly (ADP-ribose) polymerase were inhibited in chlamydia-infected cells. Mitochondrial cytochrome c release into the cytosol induced by proapoptotic factors was also prevented by chlamydial infection. These observations suggest that chlamydial proteins may interrupt diverse apoptotic pathways by blocking mitochondrial cytochrome c release, a central step proposed to convert the upstream private pathways into an effector apoptotic pathway for amplification of downstream caspases. Thus, we have identified a chlamydial antiapoptosis mechanism(s) that will help define chlamydial pathogenesis and may also provide information about the central mechanisms regulating host cell apoptosis.


Figures

Figure 1
Figure 1
(A) Chlamydia-infected HeLa cells are resistant to apoptosis induced by staurosporine. HeLa cells with (c–e and h–j) or without (a, b, f, and g) chlamydial infection at an MOI of 5 (+high, top, c, d, h, and i) or 0.5 (+low, e and j) were treated with (b, d, e, g, i, and j) or without (a, c, f, and h) 1 μM staurosporine for 4 h. The cell samples were then either stained with Hoechst dye and viewed under a fluorescence microscope (a–e) or doubly labeled with dUTP (green) and an antichlamydial antibody (red) and viewed under a confocal microscope (f–j) as described in Materials and Methods. Hoechst dye stained both HeLa cell nuclei (black arrowhead, apoptotic nuclei) and the cytoplasmic chlamydial inclusion bodies (white arrowheads). (B) Chlamydia-infected HeLa cells are resistant to apoptosis induced by multiple apoptotic stimuli. Host cells with (solid bars) or without (open bars) chlamydial infection were stimulated with staurosporine (Stau), etoposide (ET), granzyme B/perforin (GB/P), an anti-Fas IgM antibody CH11 (αFas), or TNF-α. The cell samples were then stained with Hoechst dye. Cells from five random fields were counted under an object lens of ×40 and the percent of apoptotic cells were calculated (displayed along the y-axis). The figure shows the results from three independent experiments. The variations between the three experiments were <20% as indicated by error bars.
Figure 1
Figure 1
(A) Chlamydia-infected HeLa cells are resistant to apoptosis induced by staurosporine. HeLa cells with (c–e and h–j) or without (a, b, f, and g) chlamydial infection at an MOI of 5 (+high, top, c, d, h, and i) or 0.5 (+low, e and j) were treated with (b, d, e, g, i, and j) or without (a, c, f, and h) 1 μM staurosporine for 4 h. The cell samples were then either stained with Hoechst dye and viewed under a fluorescence microscope (a–e) or doubly labeled with dUTP (green) and an antichlamydial antibody (red) and viewed under a confocal microscope (f–j) as described in Materials and Methods. Hoechst dye stained both HeLa cell nuclei (black arrowhead, apoptotic nuclei) and the cytoplasmic chlamydial inclusion bodies (white arrowheads). (B) Chlamydia-infected HeLa cells are resistant to apoptosis induced by multiple apoptotic stimuli. Host cells with (solid bars) or without (open bars) chlamydial infection were stimulated with staurosporine (Stau), etoposide (ET), granzyme B/perforin (GB/P), an anti-Fas IgM antibody CH11 (αFas), or TNF-α. The cell samples were then stained with Hoechst dye. Cells from five random fields were counted under an object lens of ×40 and the percent of apoptotic cells were calculated (displayed along the y-axis). The figure shows the results from three independent experiments. The variations between the three experiments were <20% as indicated by error bars.
Figure 3
Figure 3
Effect of chlamydial infection on caspase 3 processing, PARP cleavage, and DNA fragmentation. HeLa cells with (lanes 3 and 4) or without (lanes 1 and 2) chlamydial infection and with (lanes 2 and 4) or without (lanes 1 and 3) staurosporine (1 μM) treatment were lysed for Western blot analysis using antibodies against caspase 3 (top) or PARP (middle). The caspase 3 and PARP antibody staining was developed with a secondary antibody conjugated to horseradish peroxidase followed by visualization using an ECL as described in Materials and Methods. A 3% agarose gel was used for the DNA ladder assay and ethidium bromide was used to visualize the DNA bands (bottom).
Figure 2
Figure 2
(A) Time course relationship between chlamydial infection dose and host cell apoptosis induced by staurosporine. HeLa cells were infected with chlamydial organisms with an MOI of 0 (filled circles), 0.5 (open squares), 5 (filled squares), or 50 (open circles). At various time points after infection (0, 6, 12, 24, 36, or 48 h) as indicated along the x-axis, the cells were stimulated with 1 μM staurosporine for 4 h and stained with Hoechst dye for evaluating the percentage of apoptotic cells as described in the Fig. 1 B legend. The figure shows the result from one representative experiment of three independent experiments that were performed. (B) Effect of antibiotics and cycloheximide on chlamydial antiapoptotic activity. HeLa cells infected with (hatched bars) or without (open bars) chlamydia in the presence of 1 μg/ml of rifampin, 60 μg/ml of chloramphenicol, or 100 μg/ ml penicillin G as indicated. Cycloheximide was added to the culture wells at a final concentration of 10 μg/ml 2 h before and during staurosporine stimulation. After 1 μM staurosporine stimulation for 4 h, cell samples were analyzed for percentage of apoptotic cells as described in the Fig. 1 B legend. The figure shows the result from three independent experiments. The variations between the three experiments were <20% as indicated by error bars in the figure.
Figure 2
Figure 2
(A) Time course relationship between chlamydial infection dose and host cell apoptosis induced by staurosporine. HeLa cells were infected with chlamydial organisms with an MOI of 0 (filled circles), 0.5 (open squares), 5 (filled squares), or 50 (open circles). At various time points after infection (0, 6, 12, 24, 36, or 48 h) as indicated along the x-axis, the cells were stimulated with 1 μM staurosporine for 4 h and stained with Hoechst dye for evaluating the percentage of apoptotic cells as described in the Fig. 1 B legend. The figure shows the result from one representative experiment of three independent experiments that were performed. (B) Effect of antibiotics and cycloheximide on chlamydial antiapoptotic activity. HeLa cells infected with (hatched bars) or without (open bars) chlamydia in the presence of 1 μg/ml of rifampin, 60 μg/ml of chloramphenicol, or 100 μg/ ml penicillin G as indicated. Cycloheximide was added to the culture wells at a final concentration of 10 μg/ml 2 h before and during staurosporine stimulation. After 1 μM staurosporine stimulation for 4 h, cell samples were analyzed for percentage of apoptotic cells as described in the Fig. 1 B legend. The figure shows the result from three independent experiments. The variations between the three experiments were <20% as indicated by error bars in the figure.
Figure 4
Figure 4
(A) Immunofluorescence analysis of the effect of chlamydial infection on cytochrome c distribution. HeLa cells were infected with chlamydial organisms and treated with staurosporine (1 μM) as described in the Fig. 1 A legend. The cells were then either stained for cytochrome c (red) and chlamydial antigens (green) and viewed under a confocal microscope (a–e) or stained for cytochrome c (red) and DNA (blue; apoptotic nuclei, white arrowheads; chlamydial inclusion bodies, white stars) with Hoechst dye and viewed under a fluorescence microscope (f–j). Punctate red staining, mitochondrial localization; diffuse red staining, cytosolic localization. (B) Western blot analysis of chlamydial inhibition of mitochondrial cytochrome c release induced by staurosporine. HeLa cells were infected with chlamydial organisms and treated with staurosporine (1 μM) as described in the Fig. 3 legend. The cell samples were then fractionated into cytosol (lanes 1–4) and mitochondrial (5–8) fractions, and analyzed by Western blot analysis. A mouse mAb that specifically recognizes denatured cytochrome c was used to stain the blot and a secondary antibody conjugated with horseradish peroxidase was used to detect the first antibody binding. The antibody reaction was visualized with ECL as described in Materials and Methods. The arrow denotes the position of cytochrome c and the high molecular bands may represent proteins that cross-reacted with the anti–cytochrome c antibody. (C) Chlamydial infection suppresses mitochondrial cytochrome c release induced by TNF-α and anti-Fas antibody cross-linking. U937 cells were infected with chlamydial organism at an MOI of 20. 30 h after infection, the cells were treated with either 40 ng/ml of human TNF-α for 4 h (a–c) or a mouse IgM antibody (CH11) against human Fas at 250 ng/ml for 8 h (d–f  ). Both treatments were carried out in the presence of 2 μg/ml of cycloheximide. The control cell samples were treated with cycloheximide alone. The treated cell samples were then fractionated into cytosolic (b and e) and mitochondrial fractions (a and d  ) for Western blot analysis as described in the Fig. 4 B legend. c was from the b blot; after stripping, the b blot was restained with an anti–caspase 3 antibody. f was similarly restained after stripping e.
Figure 4
Figure 4
(A) Immunofluorescence analysis of the effect of chlamydial infection on cytochrome c distribution. HeLa cells were infected with chlamydial organisms and treated with staurosporine (1 μM) as described in the Fig. 1 A legend. The cells were then either stained for cytochrome c (red) and chlamydial antigens (green) and viewed under a confocal microscope (a–e) or stained for cytochrome c (red) and DNA (blue; apoptotic nuclei, white arrowheads; chlamydial inclusion bodies, white stars) with Hoechst dye and viewed under a fluorescence microscope (f–j). Punctate red staining, mitochondrial localization; diffuse red staining, cytosolic localization. (B) Western blot analysis of chlamydial inhibition of mitochondrial cytochrome c release induced by staurosporine. HeLa cells were infected with chlamydial organisms and treated with staurosporine (1 μM) as described in the Fig. 3 legend. The cell samples were then fractionated into cytosol (lanes 1–4) and mitochondrial (5–8) fractions, and analyzed by Western blot analysis. A mouse mAb that specifically recognizes denatured cytochrome c was used to stain the blot and a secondary antibody conjugated with horseradish peroxidase was used to detect the first antibody binding. The antibody reaction was visualized with ECL as described in Materials and Methods. The arrow denotes the position of cytochrome c and the high molecular bands may represent proteins that cross-reacted with the anti–cytochrome c antibody. (C) Chlamydial infection suppresses mitochondrial cytochrome c release induced by TNF-α and anti-Fas antibody cross-linking. U937 cells were infected with chlamydial organism at an MOI of 20. 30 h after infection, the cells were treated with either 40 ng/ml of human TNF-α for 4 h (a–c) or a mouse IgM antibody (CH11) against human Fas at 250 ng/ml for 8 h (d–f  ). Both treatments were carried out in the presence of 2 μg/ml of cycloheximide. The control cell samples were treated with cycloheximide alone. The treated cell samples were then fractionated into cytosolic (b and e) and mitochondrial fractions (a and d  ) for Western blot analysis as described in the Fig. 4 B legend. c was from the b blot; after stripping, the b blot was restained with an anti–caspase 3 antibody. f was similarly restained after stripping e.

Similar articles

Cited by

References

    1. Shen Y, Shenk TE. Viruses and apoptosis. Curr Opin Genet Dev. 1995;5:105–111. - PubMed
    1. Antoni BA, Sabbatini P, Rabson AB, White E. Inhibition of apoptosis in human immunodeficiency virus–infected cells enhances virus production and facilitates persistent infection. J Virol. 1995;69:2384–2392. - PMC - PubMed
    1. Lee JC, Chen HH, Wei HL, Chao YC. Superinfection-induced apoptosis and its correlation with the reduction of viral progeny in cells persistently infected with Hz-1 baculovirus. J Virol. 1993;67:6989–6994. - PMC - PubMed
    1. Molloy A, Laochumroonvorapong P, Kaplan G. Apoptosis, but not necrosis, of infected monocytes is coupled with killing of intracellular bacillus Calmette-Guérin. J Exp Med. 1994;180:1499–1509. - PMC - PubMed
    1. Fratazzi C, Arbeit RD, Carini C, Remold HG. Programmed cell death of Mycobacterium avium serovar4–infected human macrophages prevents the mycobacteria from spreading and induces mycobacterial growth inhibition by freshly added, uninfected macrophages. J Immunol. 1997;158:4320–4327. - PubMed

Publication types