

Subsets of transgenic T cells that recognize CD1 induce or prevent murine lupus: role of cytokines
- PMID: 9463403
- PMCID: PMC2212154
- DOI: 10.1084/jem.187.4.525
Subsets of transgenic T cells that recognize CD1 induce or prevent murine lupus: role of cytokines
Abstract
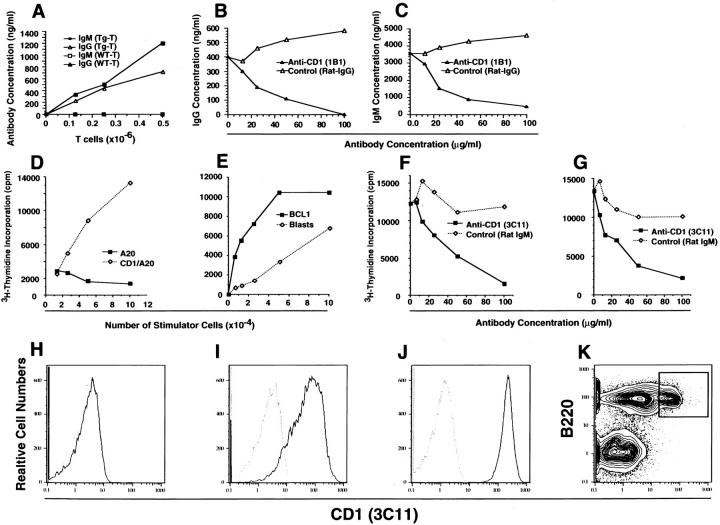
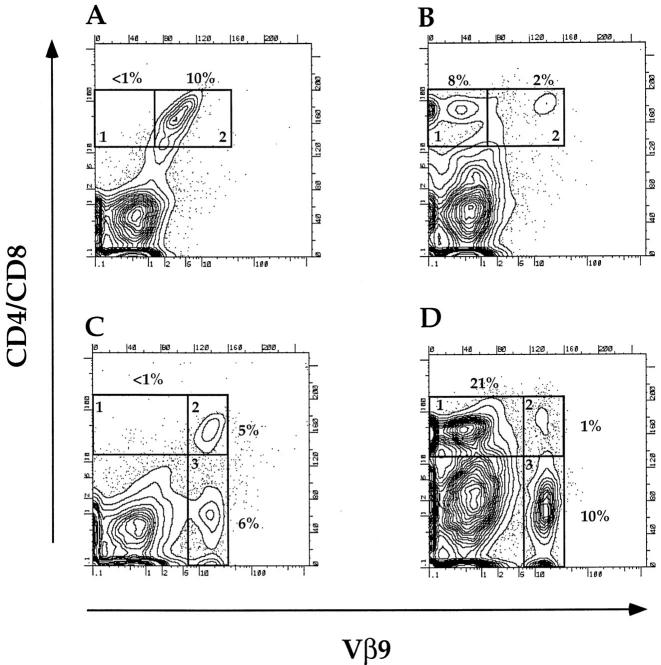
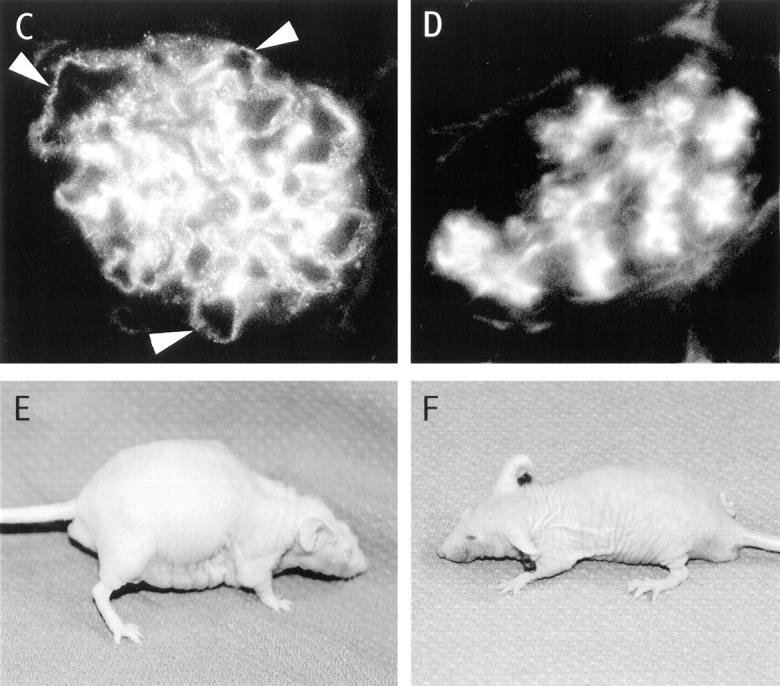
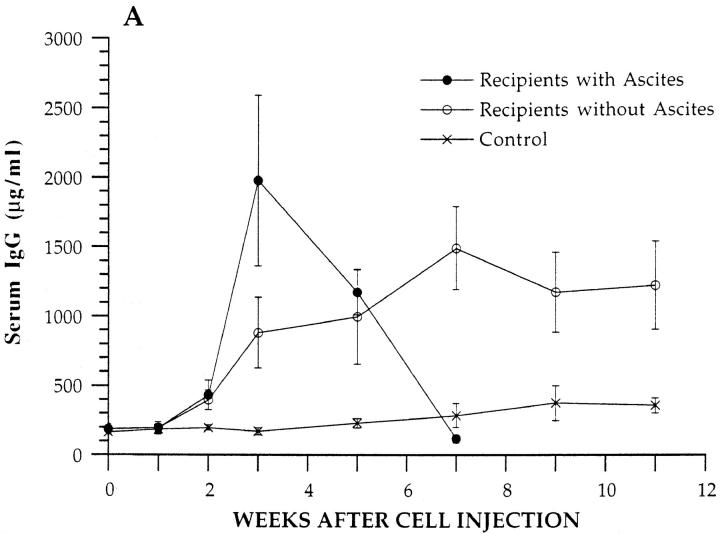
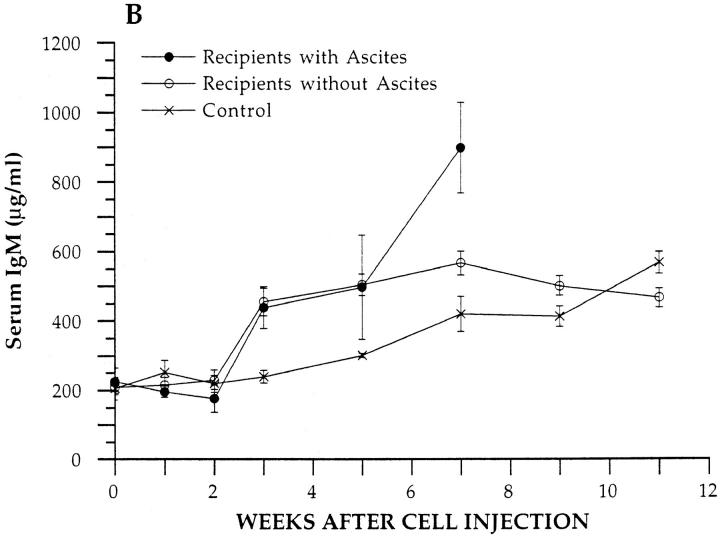
T cells with T cell receptor (TCR) transgenes that recognized CD1 on syngeneic B cells stimulated B cells to secrete immunoglobulins in vitro. The CD4+, CD8+, or CD4-CD8- T cells from the spleen of the TCR transgenic BALB/c donors induced lupus with anti-double stranded DNA antibodies, proteinuria, and immune complex glomerulonephritis in irradiated BALB/c nude mice reconstituted with nude bone marrow. Injection of purified CD4-CD8- T cells from the marrow of transgenic donors prevented the induction of lupus by the transgenic T cells. Transgenic T cells that induced lupus secreted large amounts of interferon (IFN)-gamma and little interleukin (IL)-4, and those that prevented lupus secreted large amounts of IL-4 and little IFN-gamma or IL-10.
Figures

Similar articles
-
Characterization of novel antigens recognized by serum autoantibodies from anti-CD1 TCR-transgenic lupus mice.Eur J Immunol. 2004 Jun;34(6):1654-62. doi: 10.1002/eji.200324201. Eur J Immunol. 2004. PMID: 15162435
-
T cell cytokine imbalance towards production of IFN-gamma and IL-10 in NZB/W F1 lupus-prone mice is associated with autoantibody levels and nephritis.Scand J Rheumatol. 2006 May-Jun;35(3):209-16. doi: 10.1080/03009740500417791. Scand J Rheumatol. 2006. PMID: 16766368
-
Expression of pro-inflammatory cytokines by TCR alpha beta+ and TCR gamma delta+ T cells in an experimental model of colitis.Eur J Immunol. 1997 Jan;27(1):17-25. doi: 10.1002/eji.1830270104. Eur J Immunol. 1997. PMID: 9021993
-
CD1d-independent developmental acquisition of prompt IL-4 gene inducibility in thymus CD161(NK1)-CD44lowCD4+CD8- T cells is associated with complementarity determining region 3-diverse and biased Vbeta2/Vbeta7/Vbeta8/Valpha3.2 T cell receptor usage.J Immunol. 2005 Nov 15;175(10):6537-50. doi: 10.4049/jimmunol.175.10.6537. J Immunol. 2005. PMID: 16272308
-
Advances in lupus stemming from the parent-into-F1 model.Trends Immunol. 2010 Jun;31(6):236-45. doi: 10.1016/j.it.2010.02.001. Epub 2010 Mar 31. Trends Immunol. 2010. PMID: 20362509 Free PMC article. Review.
Cited by
-
Germline deletion of β2 microglobulin or CD1d reduces anti-phospholipid antibody, but increases autoantibodies against non-phospholipid antigens in the NZB/W F1 model of lupus.Arthritis Res Ther. 2013 Mar 27;15(2):R47. doi: 10.1186/ar4206. Arthritis Res Ther. 2013. PMID: 23531237 Free PMC article.
-
NKT Cell Subsets Can Exert Opposing Effects in Autoimmunity, Tumor Surveillance and Inflammation.Curr Immunol Rev. 2012 Nov 1;8(4):287-296. doi: 10.2174/157339512804806224. Curr Immunol Rev. 2012. PMID: 25288922 Free PMC article.
-
Beta-galactosylceramide alters invariant natural killer T cell function and is effective treatment for lupus.Clin Immunol. 2009 Sep;132(3):321-33. doi: 10.1016/j.clim.2009.05.018. Epub 2009 Jun 28. Clin Immunol. 2009. PMID: 19564135 Free PMC article.
-
Molecular recognition of lipid antigens by T cell receptors.J Exp Med. 1999 Jan 4;189(1):195-205. doi: 10.1084/jem.189.1.195. J Exp Med. 1999. PMID: 9874576 Free PMC article.
-
Modulatory function of invariant natural killer T cells in systemic lupus erythematosus.Clin Dev Immunol. 2012;2012:478429. doi: 10.1155/2012/478429. Epub 2012 Jun 13. Clin Dev Immunol. 2012. PMID: 22761630 Free PMC article. Review.
References
-
- Theofilopoulous AN, Kofler R, Singer PA, Dixon FJ. Molecular genetics of murine lupus models. Adv Immunol. 1989;46:61–109. - PubMed
-
- Yoshida S, Castles JJ, Gershwin ME. The pathogenesis of autoimmunity in New Zealand mice. Semin Arthritis Rheum. 1990;19:224–242. - PubMed
-
- Hahn, B.H. 1993. Animal models of systemic lupus erythematosus. In Dubois Lupus Erythematosus. 4th ed. D.J. Wallace and B.H. Hahn, editors. Philadelphia, PA: Lea and Febiger, Philadelphia. 157–177.
-
- O'Keefe TL, Datta SK, Imanishi-Kari T. Cationic residues in pathogenic anti-DNA autoantibodies arise by mutations of a germline gene that belongs to a large VH gene subfamily. Eur J Immunol. 1992;22:619–624. - PubMed
Publication types
MeSH terms
Substances
Grants and funding
LinkOut - more resources
Full Text Sources
Other Literature Sources
Medical
Research Materials
