. 1998 Feb 16;187(4):561-9.
doi: 10.1084/jem.187.4.561.

Infection of mice with Mycobacterium bovis-Bacillus Calmette-Guérin (BCG) suppresses allergen-induced airway eosinophilia

Affiliations

Infection of mice with Mycobacterium bovis-Bacillus Calmette-Guérin (BCG) suppresses allergen-induced airway eosinophilia

K J Erb et al. J Exp Med. .

Abstract

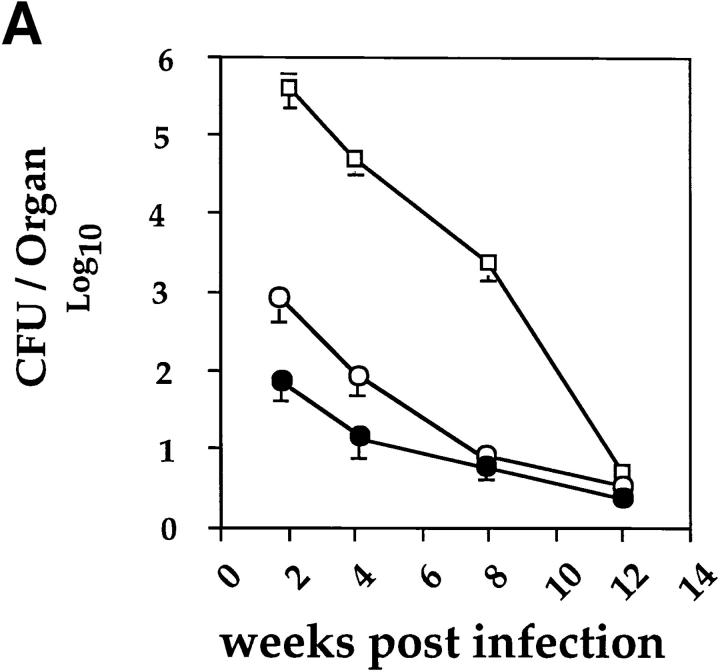
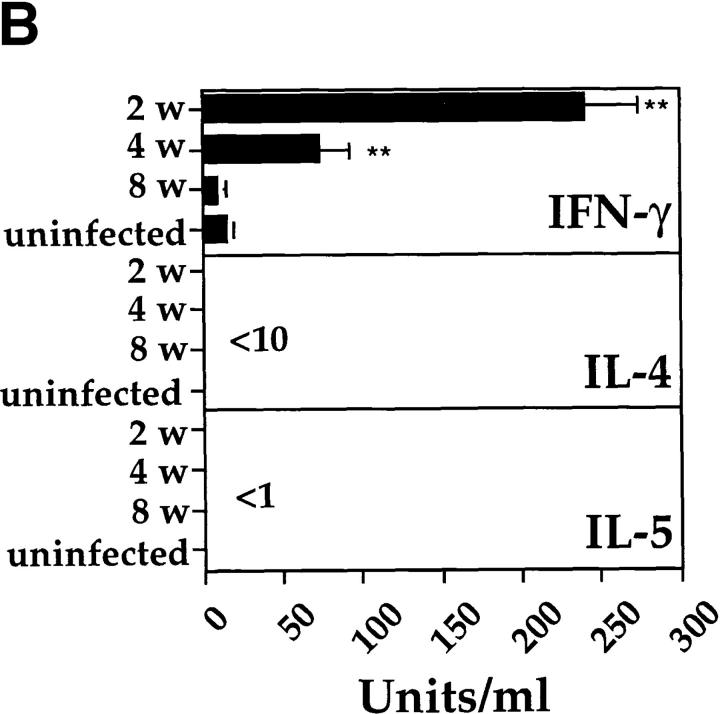
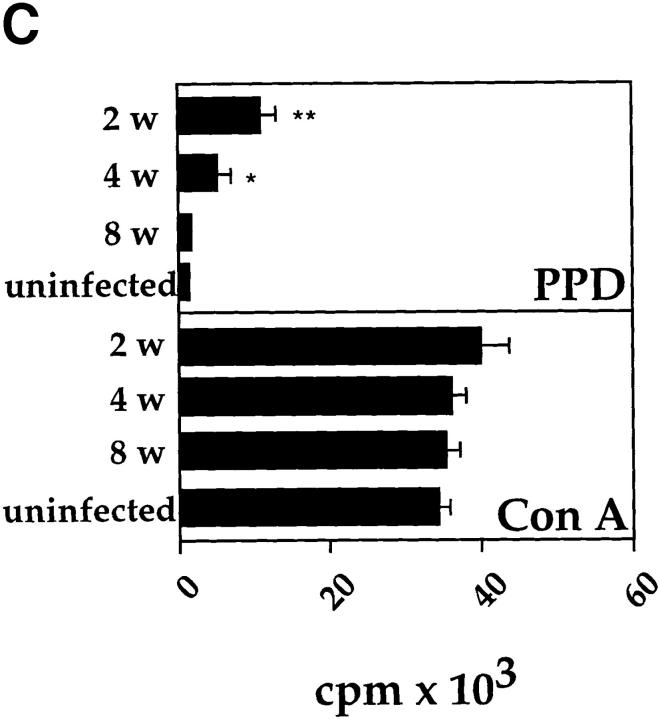
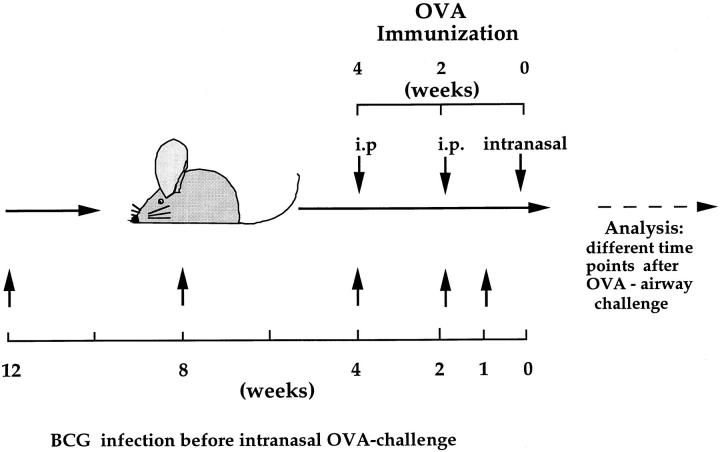
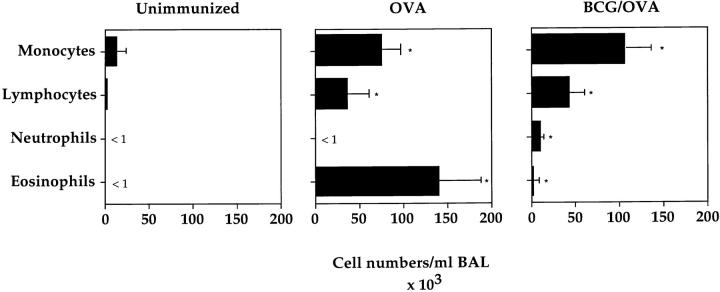
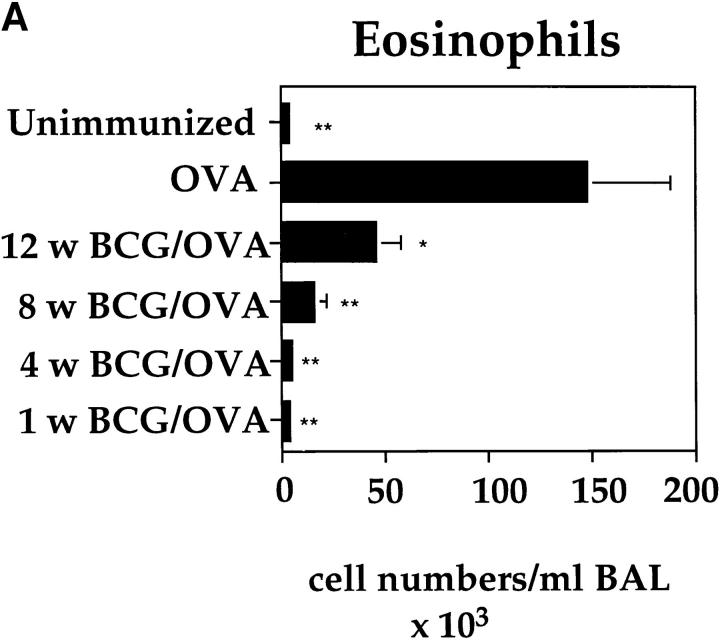
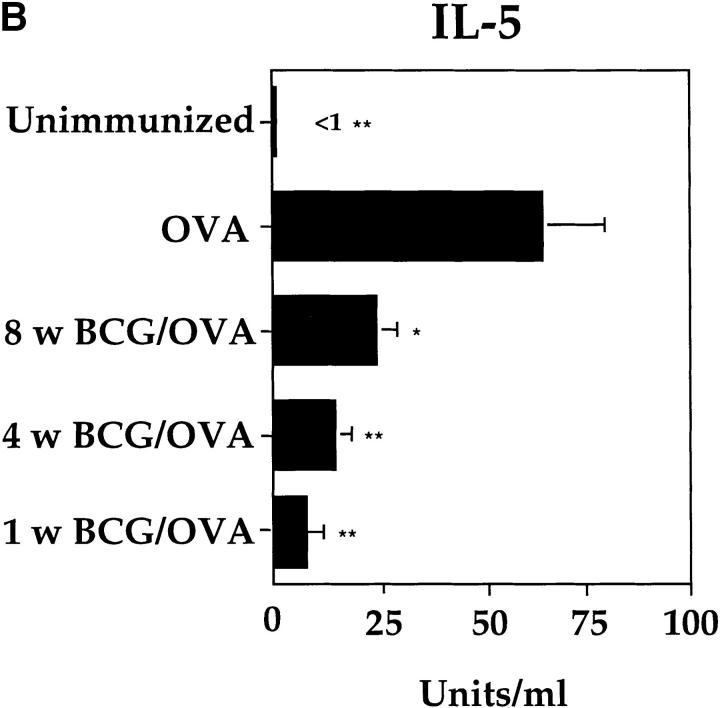
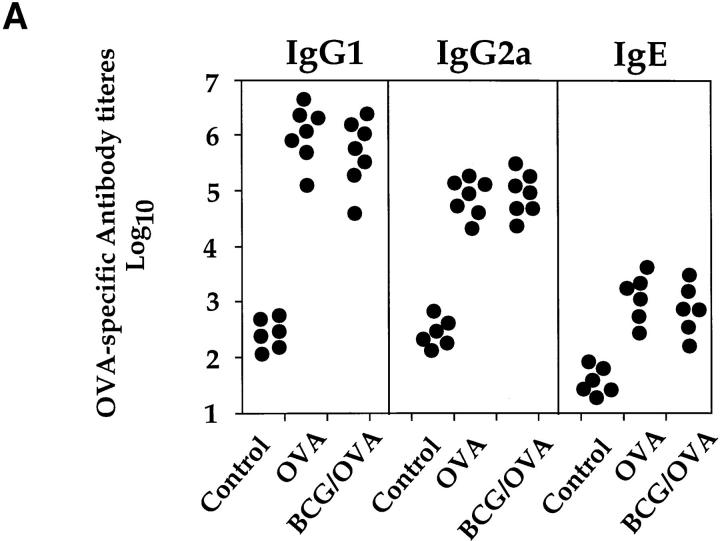
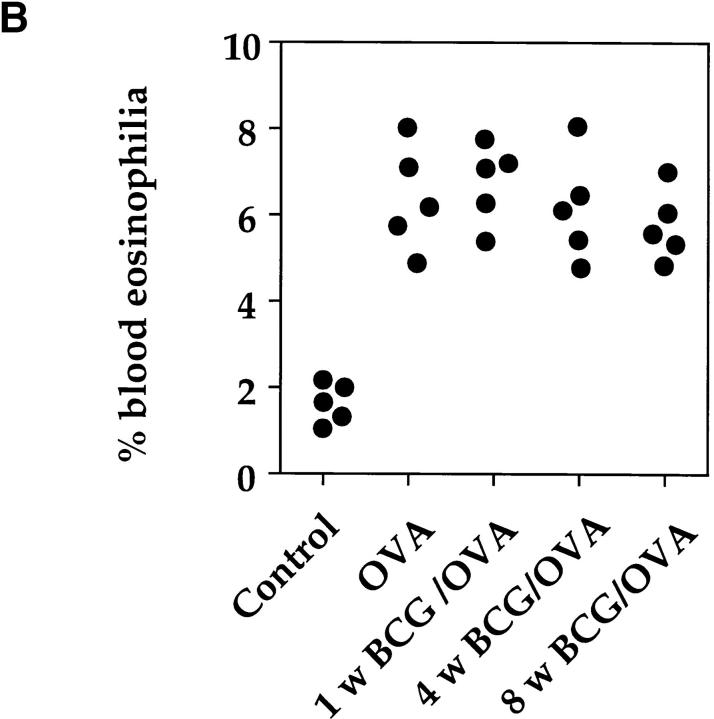
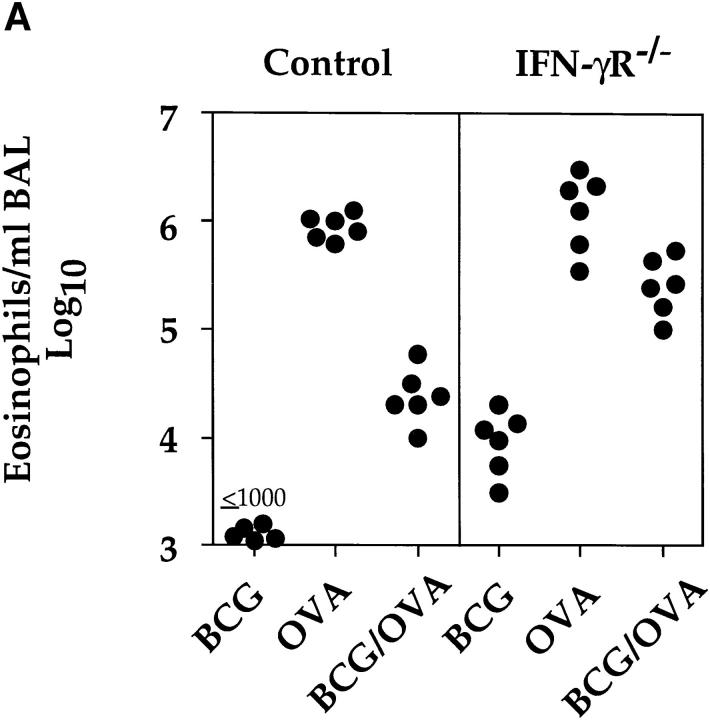
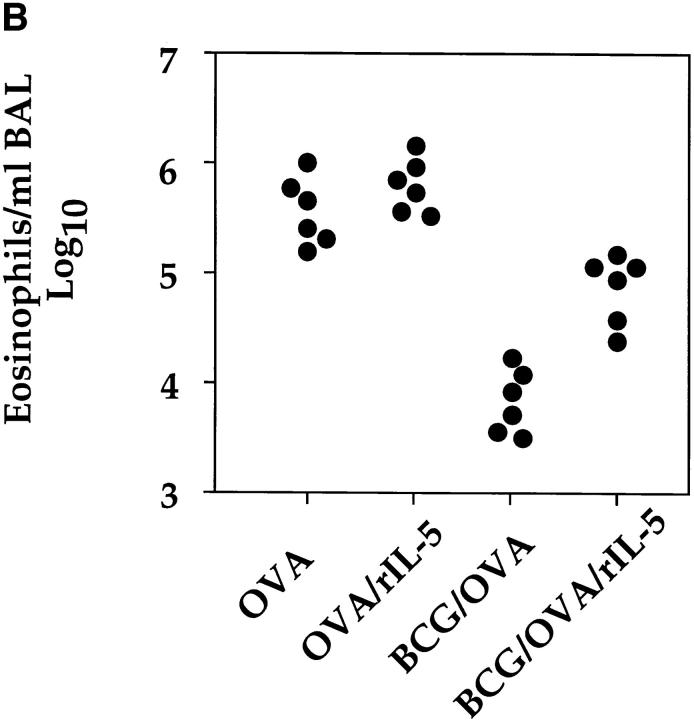
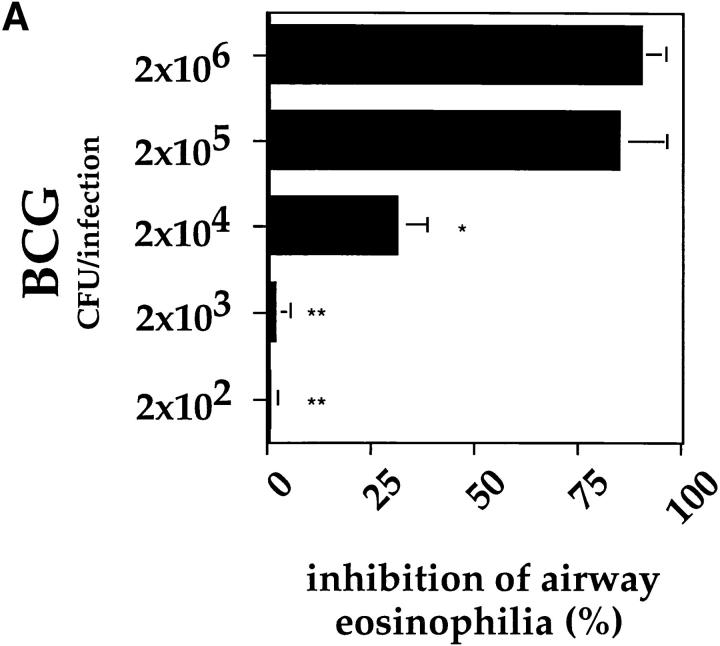
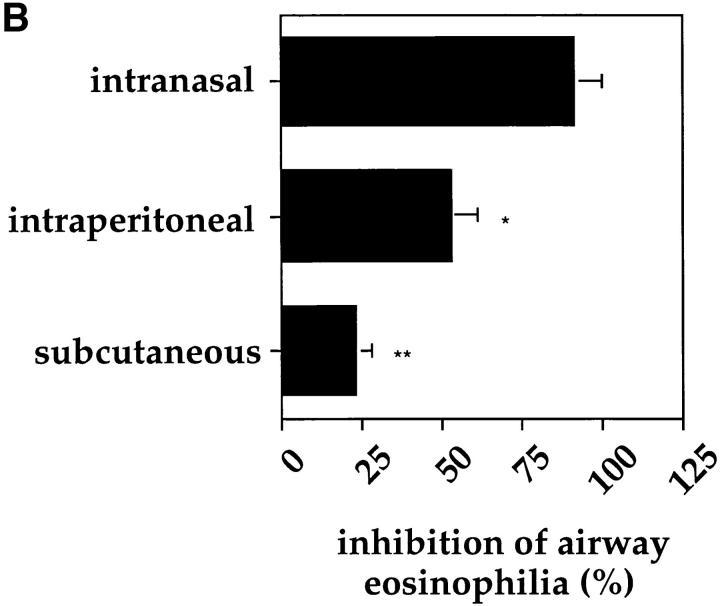
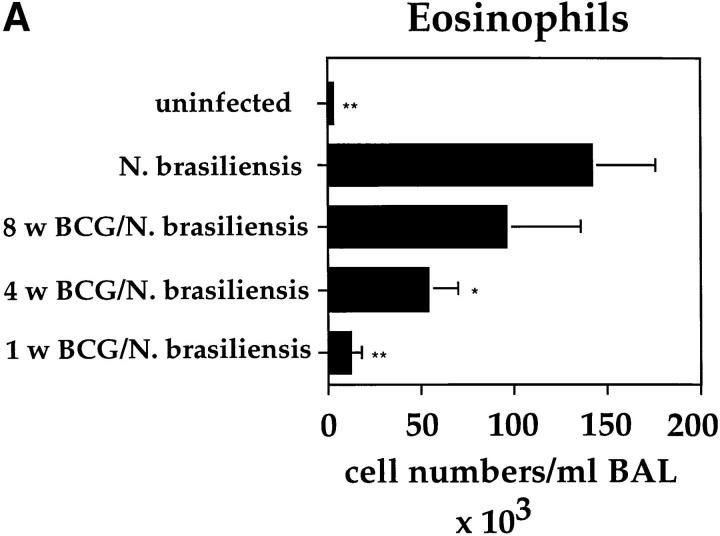
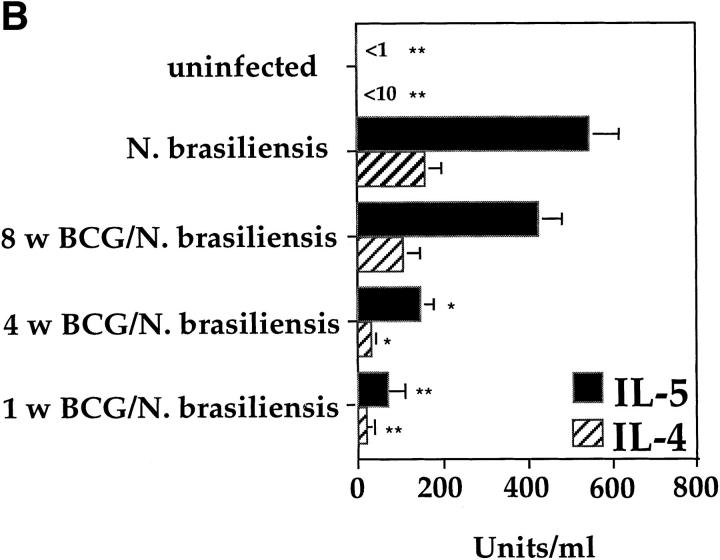
It has been proposed that the increase in prevalence and severity of atopic disorders inversely correlates with exposure to infectious diseases such as tuberculosis. We have investigated this issue by combining an intranasal Mycobacterium bovis-Bacillus Calmette-Guérin (BCG) infection with a murine model of allergen, (ovalbumin [OVA]) induced airway eosinophilia. BCG infection either 4 or 12 wk before allergen airway challenge resulted in a 90-95 and 60-70% reduction in eosinophilia within the lungs, respectively, compared to uninfected controls. The inhibition of airway eosinophilia correlated with a reduced level of IL-5 production by T cells from the lymph node draining the site of OVA challenge. Interestingly, BCG infection of the lung had no effect on IgG1 and IgE OVA-specific serum immunoglobulin or blood eosinophil levels. Furthermore, BCG-induced inhibition of airway eosinophilia was strongly reduced in interferon (IFN)-gamma receptor-deficient mice and could be partially reversed by intranasal IL-5 application. Intranasal BCG infections could also reduce the degree of lung eosinophilia and IL-5 produced by T cells after Nippostrongylus brasiliensis infection. Taken together, our data suggest that IFN-gamma produced during the T helper cell (Th)1 immune response against BCG suppresses the development of local inflammatory Th2 responses in the lung. Most importantly, this inhibition did not extend to the systemic immunoglobulin response against OVA. Our data support the view that mycobacterial infections have the potential to suppress the development of atopic disorders in humans.


Figures

Figure 1
Figure 1
Intranasal infection of mice with BCG induces a Th1 response in the lung. (A) Mycobacterial clearance from mice intranasally infected with 2 × 10⁵ CFUs of BCG organisms. The course of infection in the lung (open squares), liver (open circles), and spleen (closed circles) was followed over 12 wk after infection. Data shown are the mean bacterial counts of tissues from nine mice (three separate experiments) with standard deviations. (B) IFN-γ, IL-4, and IL-5 production by T cells from MLNs after in vitro restimulation with PPD. Single-cell suspensions (2 × 10⁵/well) from total MLNs of control and 2-, 4-, and 8-wk postinfected mice, were stimulated in vitro for 48 h with PPD (10 μg/ml). The level of cytokines present in the supernatants was determined by ELISA. Shown are the mean values of three separate experiments with standard deviation (for each experiment lymph nodes from three mice in each group were pooled). (C) [3H]thymidine uptake by mediastinal lymphocytes of control and BCG-infected mice after stimulation with PPD or the lectin Con A. LN cells (2 × 10⁵ cells/well) from uninfected and BCG-infected mice were incubated with medium, PPD (10 μg/ml), or Con A (5 μg/ml) for 40 h, and then pulsed with [3H]thymidine for the last 16 h of the culture period. Mean [3H]thymidine uptake of triplicates with standard deviations are shown. Uptake of [3H]thymidine was between 500 and 1,000 cpm in all cultures containing cells and medium alone. The experiments were repeated three times with similar results. *P <0.05, **P <0.0001, compared to values obtained in cultures containing cells from uninfected mice.
Figure 1
Figure 1
Intranasal infection of mice with BCG induces a Th1 response in the lung. (A) Mycobacterial clearance from mice intranasally infected with 2 × 10⁵ CFUs of BCG organisms. The course of infection in the lung (open squares), liver (open circles), and spleen (closed circles) was followed over 12 wk after infection. Data shown are the mean bacterial counts of tissues from nine mice (three separate experiments) with standard deviations. (B) IFN-γ, IL-4, and IL-5 production by T cells from MLNs after in vitro restimulation with PPD. Single-cell suspensions (2 × 10⁵/well) from total MLNs of control and 2-, 4-, and 8-wk postinfected mice, were stimulated in vitro for 48 h with PPD (10 μg/ml). The level of cytokines present in the supernatants was determined by ELISA. Shown are the mean values of three separate experiments with standard deviation (for each experiment lymph nodes from three mice in each group were pooled). (C) [3H]thymidine uptake by mediastinal lymphocytes of control and BCG-infected mice after stimulation with PPD or the lectin Con A. LN cells (2 × 10⁵ cells/well) from uninfected and BCG-infected mice were incubated with medium, PPD (10 μg/ml), or Con A (5 μg/ml) for 40 h, and then pulsed with [3H]thymidine for the last 16 h of the culture period. Mean [3H]thymidine uptake of triplicates with standard deviations are shown. Uptake of [3H]thymidine was between 500 and 1,000 cpm in all cultures containing cells and medium alone. The experiments were repeated three times with similar results. *P <0.05, **P <0.0001, compared to values obtained in cultures containing cells from uninfected mice.
Figure 2
Figure 2
Experimental design used to investigate the influence of a BCG infection on OVA-induced eosinophilia in the lung. Mice were subjected to the OVA immunization scheme (see Materials and Methods) and intranasally infected with 2 × 10⁵ CFUs of BCG organisms 1, 4, 8, or 12 wk before intranasal OVA challenge.
Figure 3
Figure 3
Intranasal infection of BCG strongly inhibits the development of airway eosinophilia. OVA-immunized mice were either intranasally infected with 2 × 10⁵ CFUs of BCG 4 wk before OVA airway challenge or left uninfected as an OVA control (see Fig. 2). 6 d after the OVA airway challenge, a BAL was performed on both groups of mice as well as unimmunized mice. BAL cells were counted, stained with haematoxylin and eosin, and the different cell types were identified microscopically. Shown are the average numbers of cells, with standard deviation, present in the BALs of the different groups of mice (five mice per group). The experiments were repeated five times with similar results. *P <0.01, compared to values obtained in unimmunized mice.
Figure 4
Figure 4
BCG-induced suppression of airway eosinophilia and reduction of IL-5 secretion by T cells is dependent upon the elapsed time from BCG infection. OVA-immunized mice were either subjected to BCG infection at 1, 4, 8, or 12 wk before OVA airway challenge or left uninfected. Age-matched mice not subjected to the OVA immunization (Unimmunized) were included as controls. 6 d after OVA airway challenge, BALs were performed on each group of mice. Shown are the average numbers of eosinophils present in the BALs of the different groups (n = 5 for each group) of mice (A). In parallel to the BALs, single-cell suspensions (2 × 10⁵ cells/well) from MLNs of the different groups of mice were prepared and stimulated in vitro for 48 h on anti-CD3–bound plates in the presence of IL-2. Shown is the amount of IL-5 present in the MLN cultures from three individual mice per group with standard deviation (B). The experiments were repeated at least three times with similar results. *P <0.05, **P <0.0001, compared to values obtained in OVA only immunized mice.
Figure 4
Figure 4
BCG-induced suppression of airway eosinophilia and reduction of IL-5 secretion by T cells is dependent upon the elapsed time from BCG infection. OVA-immunized mice were either subjected to BCG infection at 1, 4, 8, or 12 wk before OVA airway challenge or left uninfected. Age-matched mice not subjected to the OVA immunization (Unimmunized) were included as controls. 6 d after OVA airway challenge, BALs were performed on each group of mice. Shown are the average numbers of eosinophils present in the BALs of the different groups (n = 5 for each group) of mice (A). In parallel to the BALs, single-cell suspensions (2 × 10⁵ cells/well) from MLNs of the different groups of mice were prepared and stimulated in vitro for 48 h on anti-CD3–bound plates in the presence of IL-2. Shown is the amount of IL-5 present in the MLN cultures from three individual mice per group with standard deviation (B). The experiments were repeated at least three times with similar results. *P <0.05, **P <0.0001, compared to values obtained in OVA only immunized mice.
Figure 5
Figure 5
BCG infection of the lung did not alter the development of OVA-specific IgG1, IgG2a, or IgE antibodies or blood eosinophilia. Mice were treated as described in the legend to Fig. 3. Serum and blood smears were prepared 10 d after OVA airway challenge and OVA-specific antibody levels were determined by ELISA (A). Values represent serum antibody titers from individual mice. Titers were determined by plotting A414 against the logarithm of the reciprocal of the serum dilution and taking the midpoint of the linear section of the sigmoid curve produced. Blood smears were stained with hematoxylin and eosin and the different cell types were identified microscopically. Shown is the percentage of eosinophils present in the blood of individual mice (B). As a control, sera and blood smears from age-matched uninfected mice were also analyzed.
Figure 5
Figure 5
BCG infection of the lung did not alter the development of OVA-specific IgG1, IgG2a, or IgE antibodies or blood eosinophilia. Mice were treated as described in the legend to Fig. 3. Serum and blood smears were prepared 10 d after OVA airway challenge and OVA-specific antibody levels were determined by ELISA (A). Values represent serum antibody titers from individual mice. Titers were determined by plotting A414 against the logarithm of the reciprocal of the serum dilution and taking the midpoint of the linear section of the sigmoid curve produced. Blood smears were stained with hematoxylin and eosin and the different cell types were identified microscopically. Shown is the percentage of eosinophils present in the blood of individual mice (B). As a control, sera and blood smears from age-matched uninfected mice were also analyzed.
Figure 6
Figure 6
BCG-induced suppression of airway eosinophilia was dependent upon IFN-γ signaling and could be reversed by the administration of IL-5. (A) 12 control (129/Sv/Ev) and 12 IFN-γR−/− mice were subjected to the OVA immunization protocol. From these mice, half were also infected with 2 × 10⁵ CFUs of BCG organisms 2 wk before OVA airway challenge. 6 d after intranasal OVA challenge, BALs were performed and numbers of eosinophils determined as described in the legend to Fig. 3. As controls, BALs were also prepared from non–OVA-immunized wild-type 129/Sv/Ev and IFN-γR−/− mice that had been infected with 2 × 10⁵ BCG organisms for 20 d. Shown are the numbers of eosinophils present in the BALs of six individual mice per group. (B) Four groups of mice were subjected to the OVA immunization protocol, two of which were also intranasally infected with 2 × 10⁵ CFUs of BCG 4 wk before OVA airway challenge. OVA-primed or OVA-primed and BCG-infected mice were either intranasally challenged with OVA or with a combination of OVA and IL-5 (500 units) and the numbers of eosinophils present in the BALs were determined 6 d after airway challenge. Shown are the numbers of eosinophils present in the BALs of six individual mice per group.
Figure 6
Figure 6
BCG-induced suppression of airway eosinophilia was dependent upon IFN-γ signaling and could be reversed by the administration of IL-5. (A) 12 control (129/Sv/Ev) and 12 IFN-γR−/− mice were subjected to the OVA immunization protocol. From these mice, half were also infected with 2 × 10⁵ CFUs of BCG organisms 2 wk before OVA airway challenge. 6 d after intranasal OVA challenge, BALs were performed and numbers of eosinophils determined as described in the legend to Fig. 3. As controls, BALs were also prepared from non–OVA-immunized wild-type 129/Sv/Ev and IFN-γR−/− mice that had been infected with 2 × 10⁵ BCG organisms for 20 d. Shown are the numbers of eosinophils present in the BALs of six individual mice per group. (B) Four groups of mice were subjected to the OVA immunization protocol, two of which were also intranasally infected with 2 × 10⁵ CFUs of BCG 4 wk before OVA airway challenge. OVA-primed or OVA-primed and BCG-infected mice were either intranasally challenged with OVA or with a combination of OVA and IL-5 (500 units) and the numbers of eosinophils present in the BALs were determined 6 d after airway challenge. Shown are the numbers of eosinophils present in the BALs of six individual mice per group.
Figure 7
Figure 7
Inhibition of airway eosinophilia was both dependent upon the dose and route of BCG infection. Mice were subjected to the OVA immunization protocol and infected with different doses of BCG (A) or with 2 × 10⁵ CFUs of BCG organisms either intranasally, intraperitoneally, or subcutaneously (B). All infections were performed 4 wk before OVA airway challenge. 6 d after OVA airway challenge BALs were prepared and treated as described in the legend to Fig. 3. Shown is the mean inhibition with standard deviation of the response from five age-matched mice. The experiments were repeated three times with similar results. *P <0.01, **P <0.0001, compared to percentage of inhibition using 2 × 10⁶ BCGs (A) or intranasal infection (B).
Figure 7
Figure 7
Inhibition of airway eosinophilia was both dependent upon the dose and route of BCG infection. Mice were subjected to the OVA immunization protocol and infected with different doses of BCG (A) or with 2 × 10⁵ CFUs of BCG organisms either intranasally, intraperitoneally, or subcutaneously (B). All infections were performed 4 wk before OVA airway challenge. 6 d after OVA airway challenge BALs were prepared and treated as described in the legend to Fig. 3. Shown is the mean inhibition with standard deviation of the response from five age-matched mice. The experiments were repeated three times with similar results. *P <0.01, **P <0.0001, compared to percentage of inhibition using 2 × 10⁶ BCGs (A) or intranasal infection (B).
Figure 8
Figure 8
Intranasal infection with BCG reduces airway eosinophilia and the secetion of IL-4 and IL-5 by T cells after infection with the helminth N. brasiliensis. Mice were intranasally infected with 2 × 10⁵ CFUs of BCG at the different time points indicated before intraperitoneal infection with 1,000 L3 larvae of N. brasiliensis. 10 d after N. brasiliensis infection, BAL and MLN cultures were prepared. Shown are the average numbers with standard deviations of eosinophils present in the BALs of five individual mice per group (A). MLN cells from the different groups of mice were stimulated in vitro for 48 h on anti-CD3–bound plates in the presence of IL-2. Shown is the mean amount of IL-4 and IL-5 produced by T cells in the MLN cultures from five individual mice per group with standard deviations (B). The experiments were repeated three times with similar results. *P <0.01, *p<0.001, compared to values obtained in cultures containing cells from mice only infected with N. brasiliensis.
Figure 8
Figure 8
Intranasal infection with BCG reduces airway eosinophilia and the secetion of IL-4 and IL-5 by T cells after infection with the helminth N. brasiliensis. Mice were intranasally infected with 2 × 10⁵ CFUs of BCG at the different time points indicated before intraperitoneal infection with 1,000 L3 larvae of N. brasiliensis. 10 d after N. brasiliensis infection, BAL and MLN cultures were prepared. Shown are the average numbers with standard deviations of eosinophils present in the BALs of five individual mice per group (A). MLN cells from the different groups of mice were stimulated in vitro for 48 h on anti-CD3–bound plates in the presence of IL-2. Shown is the mean amount of IL-4 and IL-5 produced by T cells in the MLN cultures from five individual mice per group with standard deviations (B). The experiments were repeated three times with similar results. *P <0.01, *p<0.001, compared to values obtained in cultures containing cells from mice only infected with N. brasiliensis.

Similar articles

Cited by

References

    1. Carballido JM, Carballido-Perrig N, Terres G, Heusser CH, Blaser K. Bee venom phospholipase A2-specific T cell clones from human allergic and non-allergic individuals: cytokine patterns change in response to the antigen concentration. Eur J Immunol. 1992;22:1357–1363. - PubMed
    1. Burrows B, Martinez FD, Halonen M, Barbee RA, Cline MG. Association of asthma with serum IgE levels and skin-test reactivity to allergens. N Engl J Med. 1989;320:271–277. - PubMed
    1. Del Prete G. Human Th1 and Th2 lymphocytes: their role in the pathophysiology of atopy. Allergy. 1992;47:450–455. - PubMed
    1. Erb KJ, LeGros G. The role of Th2 type-CD4+ T cells and CD8+ T cells in asthma. Immunol Cell Biol. 1996;74:206–209. - PubMed
    1. Mosmann TR, Cherwinski H, Bond MW, Giedlin MA, Coffman RL. Two types of murine helper T cell clone: definition according to profiles of lymphokine activities and secreted proteins. J Immunol. 1986;136:2348–2357. - PubMed

Publication types

MeSH terms