. 1998 Feb 16;187(4):619-29.
doi: 10.1084/jem.187.4.619.

CD4+ T cell-mediated granulomatous pathology in schistosomiasis is downregulated by a B cell-dependent mechanism requiring Fc receptor signaling

Affiliations

CD4+ T cell-mediated granulomatous pathology in schistosomiasis is downregulated by a B cell-dependent mechanism requiring Fc receptor signaling

D Jankovic et al. J Exp Med. .

Abstract

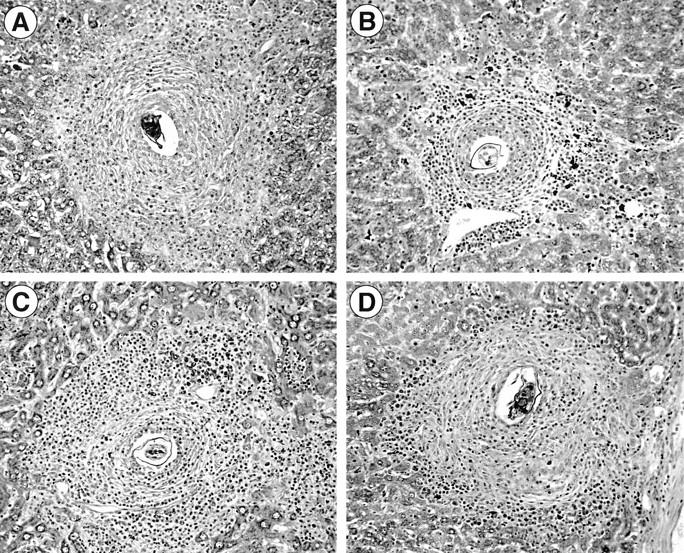
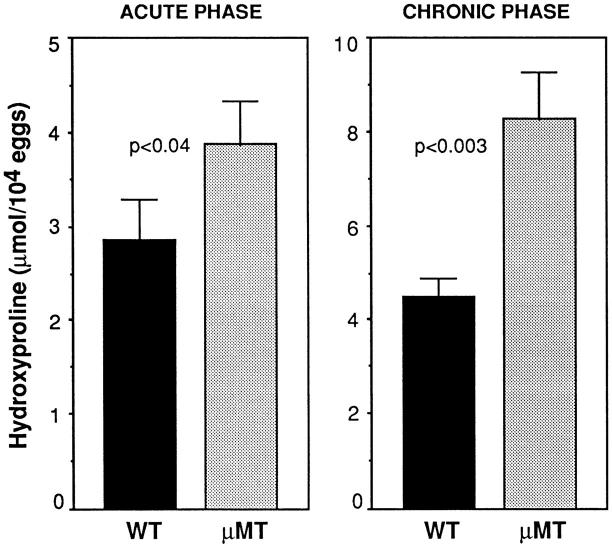
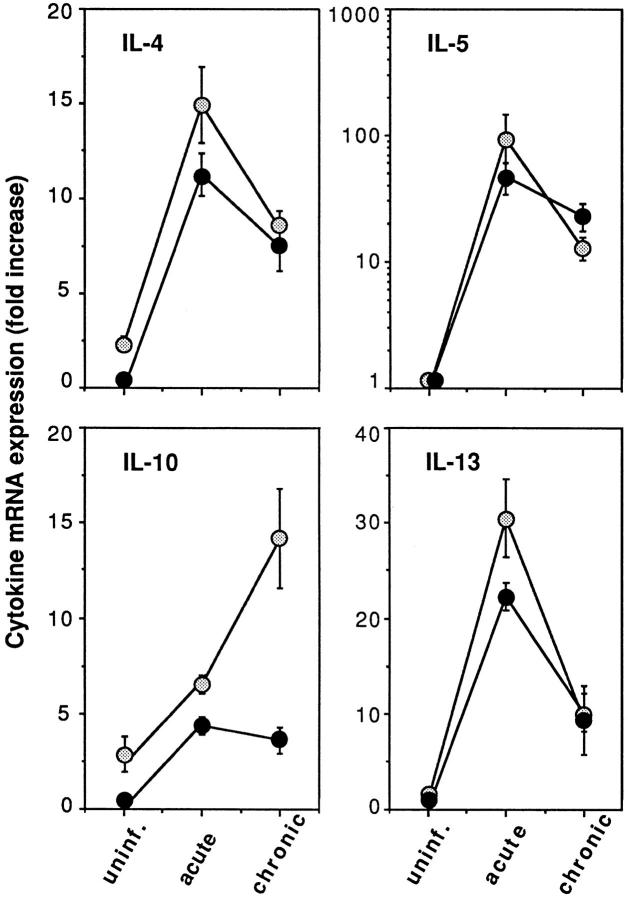
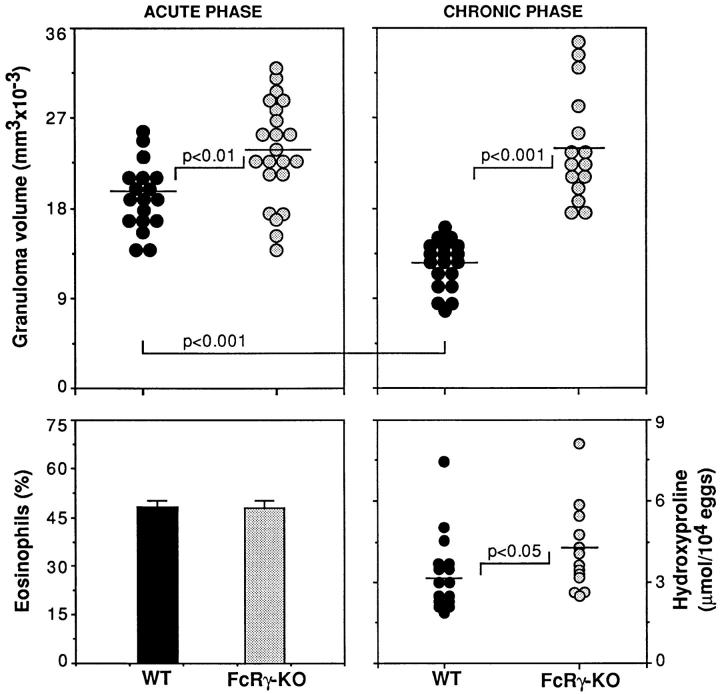
The effector functions of CD4+ T lymphocytes are generally thought to be controlled by distinct populations of regulatory T cells and their soluble products. The role of B cells in the regulation of CD4-dependent host responses is less well understood. Hepatic egg granuloma formation and fibrosis in murine schistosomiasis are dependent on CD4+ lymphocytes, and previous studies have implicated CD8+ T cells or cross-regulatory cytokines produced by T helper (Th) lymphocytes as controlling elements of this pathologic process. In this report, we demonstrate that B cell-deficient (muMT) mice exposed to Schistosoma mansoni develop augmented tissue pathology and, more importantly, fail to undergo the spontaneous downmodulation in disease normally observed during late stages of infection. Unexpectedly, B cell deficiency did not significantly alter T cell proliferative response or cause a shift in the Th1/Th2 balance. Since schistosome-infected Fc receptor-deficient (FcR gamma chain knockout) mice display the same exacerbated egg pathology as that observed in infected muMT mice, the B cell- dependent regulatory mechanism revealed by these experiments appears to require receptor-mediated cell triggering. Together, the data demonstrate that humoral immune response/FcR interactions can play a major role in negatively controlling inflammatory disease induced by CD4+ T cells.


Figures

Figure 1
Figure 1
Worm and tissue egg recoveries in S. mansoni–infected WT and B cell–deficient μMT mice. (A) The absence of B cells does not affect worm burden during primary infection. Adult worms were recovered after hepatic perfusion of infected WT (black bars) and B cell KO (gray bars) animals killed at 6 (challenge with 100 cercariae) and 8 (challenge with 40 and 25 cercariae) wk after infection. Data shown are mean parasite counts (± SEM) of six to nine animals per group. (B) Worm fecundity is unaltered in infected μMT mice. Egg output per worm pair was calculated for individual infected WT or B cell KO mice at 8 wk after infection from the total number of eggs recovered from the liver and intestine. The results shown are the means (± SEM) of data pooled from three experiments in which mice (n = 14/group) were infected with 35 cercariae. (C) Diminished egg excretion in infected B cell KO mice. The number of eggs excreted in the stools collected from individual 8-wk infected WT and B cell KO mice during the 24 h before perfusion was determined. The data shown are the mean (± SEM) egg count values pooled from the same three experiments presented in B.
Figure 2
Figure 2
Enhanced mortality in S. mansoni–infected μMT mice. Groups (n = 10) of WT and KO mice were infected percutaneously with 30 cercariae and animal survival was monitored. The hatched line indicates the 50% survival time point for B cell KO animals. As indicated, no mortality was observed in infected WT animals during the same period. The two experiments shown are representative of four performed.
Figure 3
Figure 3
Augmented egg granuloma formation in livers of S. mansoni– infected μMT mice. Upper panels: mean liver granuloma volumes of individual infected animals at 8 (left panel) and 16 wk of infection (right panel). Granuloma diameters were measured (∼30 per mouse) and mean lesion volumes were calculated for each animal and presented as a single point on the graph. The data shown are pooled from the results of 6 individual experiments in which granulomas were measured at 8 wk and from 3 experiments involving measurements at 16 wk. Within each individual experiment performed, granuloma volumes were significantly larger in the B cell KO as compared with the WT mice. Lower panels: mean (± SEM) eosinophil composition of liver granulomas determined by microscopic examination. Percentage of eosinophils was calculated from microscopic analysis of the same granulomas analyzed for lesion size. No statistically significant difference was observed between the values obtained from WT and B cell KO mice.
Figure 4
Figure 4
Photomicrographs of representative hepatic granulomas from WT control versus KO animals. The granulomas shown are from 8-wk (A) and 16-wk (B) infected C57BL/6J mice, and from 16-wk infected μMT animals (C) and 16-wk infected FcRγ KO mice (D). Original magnification of Giemsa stain, ×200.
Figure 5
Figure 5
Increased liver fibrosis in S. mansoni–infected μMT mice. Tissue hydroxyproline levels were measured in individual animals at 8 (left panel) and 16 (right panel) wk after infection. Data shown are mean values (± SEM) for four to six mice per group from one representative experiment out of six performed at the acute phase and three assayed at the chronic phase. Differences shown to be statistically significant by analysis of covariance are indicated.
Figure 6
Figure 6
Proliferative responses of μMT and WT splenocytes to SEA. Spleen cells (3 × 10⁶/ml) from individual 8-wk infected WT or B cell KO mice were cultured with the indicated concentrations of SEA and 3 d later [3H]TdR incorporation was measured after an overnight pulse (left panel). In the case of chronically (16-wk) infected mice, proliferation was assayed in response to a predetermined optimal dose (20 μg/ml) of SEA (right panel). Data shown are mean values (± SEM) of stimulation indices for each group of animals (n = 6–10).
Figure 7
Figure 7
Comparison of cytokine secretion by mesenteric LN cells from infected μMT versus WT mice. Culture supernatants of mesenteric LN cells (2 × 10⁶/ml) pooled from four to six individual mice per group were assayed for the presence of IL-4, IL-5, IL-10, and IFN-γ after 72 h in vitro stimulation with medium, SEA, or plate-bound anti-CD3 Ab. The data shown are from WT (black bars) and B cell KO (gray bars) mice killed at 8 (acute) and 14 (chronic) wk after infection. Supernatants from both time points were analyzed in the same assay and compared to the same standard curve. Bars represent the mean ± SD of ELISA values for IL-5, IL-10, and IFN-γ and values from a CT.4S assay for IL-4. In the case of SEA-induced IL-4 responses at both 8 and 14 wk, the differences between the μMT and WT values were statistically significant (P <0.001). The percentage of CD4+CD44+ cells (previously shown to represent the major population of SEA- responsive T lymphocytes; reference 31) was determined to be comparable in the WT and μMT cell preparations (data not shown).
Figure 8
Figure 8
Comparison of hepatic cytokine mRNA expression in infected μMT and WT animals. At 8 and 16 wk after infection, liver tissue from individual mice (n = 3–4 per group) were assayed for IL-4, IL-5, IL-10, and IL-13 mRNA expression by reverse transcriptase PCR. Values represent the mean fold increase (as a multiple of control value) ± SE over uninfected WT control liver mRNA expression.
Figure 9
Figure 9
Augmented egg granuloma formation in livers of S. mansoni– infected FcR γ chain KO mice. Upper panels: mean (± SEM) liver granuloma volumes of WT and FcRγ KO mice at 8 (left panel) and 16 (right panel) wk after infection. The data shown are pooled from three individual experiments in which both acute and chronic animals were analyzed, and each point represents the value for an individual mouse. Lower left panel: mean (± SEM) eosinophil composition of liver granulomas at 8 wk after infection. Lower right panel: tissue fibrosis (hydroxyproline) measured in two experiments at 16 wk. No significant differences between the WT and FcRγ KO mice were detected in lymphocyte proliferation, Th1/Th2 cytokine expression, or anti-SEA Ab titers in these experiments (data not shown).

References

    1. Colley DG. Adoptive suppression of granuloma formation. J Exp Med. 1976;143:696–700. - PMC - PubMed
    1. Colley DG, Lewis FA, Todd CW. Adoptive suppression of granuloma formation by T lymphocytes and by cells sensitive to cyclophosphamide. Cell Immunol. 1979;46:192–200. - PubMed
    1. Chensue SW, Wellhausen SR, Boros DL. Modulation of granulomatous hypersensitivity. II. Participation of Lyt1+ and Lyt2+ T lymphocytes in the suppression of granuloma formation and lymphokine production in Schistosoma mansoni-infected mice. J Immunol. 1981;127:363–367. - PubMed
    1. Chensue SW, Warmington KS, Hershey SD, Terebuh PD, Othman M, Kunkel SL. Evolving T cell responses in murine schistosomiasis. Th2 cells mediate secondary granulomatous hypersensitivity and are regulated by CD8+T cells in vivo. J Immunol. 1993;151:1391–1400. - PubMed
    1. Pearce EJ, Caspar P, Grzych JM, Lewis FA, Sher A. Downregulation of Th1 cytokine production accompanies induction of Th2 responses by a parasitic helminth, Schistosoma mansoni. . J Exp Med. 1991;173:159–166. - PMC - PubMed

Publication types

MeSH terms