

Delineating the specific influence of virus isoelectric point and size on virus adsorption and transport through sandy soils
- PMID: 9464373
- PMCID: PMC106058
- DOI: 10.1128/AEM.64.2.405-410.1998
Delineating the specific influence of virus isoelectric point and size on virus adsorption and transport through sandy soils
Abstract
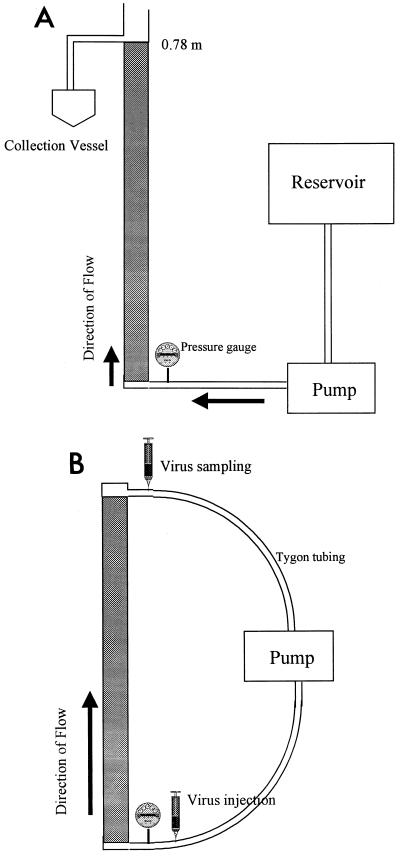
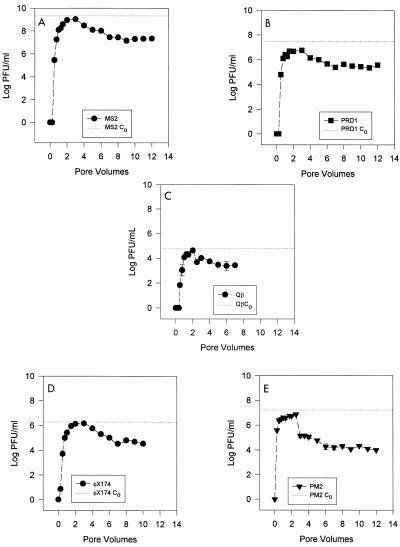
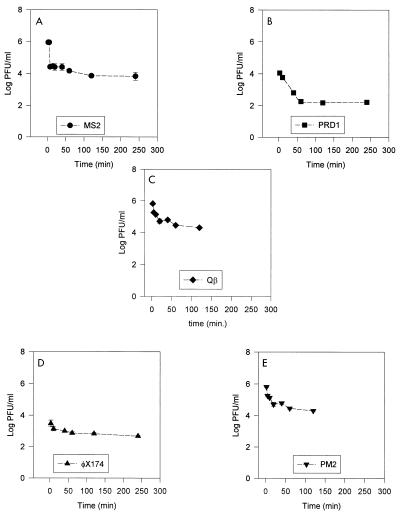
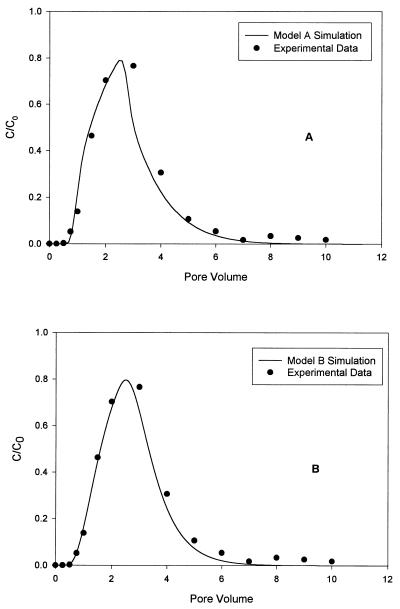
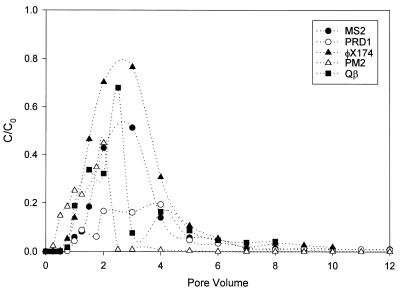
Many of the factors controlling viral transport and survival within the subsurface are still poorly understood. In order to identify the precise influence of viral isoelectric point on viral adsorption onto aquifer sediment material, we employed five different spherical bacteriophages (MS2, PRD1, Q beta, phi X174, and PM2) having differing isoelectric points (pI 3.9, 4.2, 5.3, 6.6, and 7.3 respectively) in laboratory viral transport studies. We employed conventional batch flowthrough columns, as well as a novel continuously recirculating column, in these studies. In a 0.78-m batch flowthrough column, the smaller phages (MS2, phi X174, and Q beta), which had similar diameters, exhibited maximum effluent concentration/initial concentration values that correlated exactly with their isoelectric points. In the continuously recirculating column, viral adsorption was negatively correlated with the isoelectric points of the viruses. A model of virus migration in the soil columns was created by using a one-dimensional transport model in which kinetic sorption was used. The data suggest that the isoelectric point of a virus is the predetermining factor controlling viral adsorption within aquifers. The data also suggest that when virus particles are more than 60 nm in diameter, viral dimensions become the overriding factor.
Figures
Similar articles
-
Comparative adsorption of human enteroviruses, simian rotavirus, and selected bacteriophages to soils.Appl Environ Microbiol. 1979 Aug;38(2):241-7. doi: 10.1128/aem.38.2.241-247.1979. Appl Environ Microbiol. 1979. PMID: 42350 Free PMC article.
-
Isoelectric point is an inadequate descriptor of MS2, Phi X 174 and PRD1 phages adhesion on abiotic surfaces.J Colloid Interface Sci. 2015 May 15;446:327-34. doi: 10.1016/j.jcis.2014.08.055. Epub 2014 Sep 6. J Colloid Interface Sci. 2015. PMID: 25265875
-
Viral transport in a sand and gravel aquifer under field pumping conditions.Ground Water. 2001 Nov-Dec;39(6):886-94. doi: 10.1111/j.1745-6584.2001.tb02476.x. Ground Water. 2001. PMID: 11708454
-
Use of PRD1 bacteriophage in groundwater viral transport, inactivation, and attachment studies.FEMS Microbiol Ecol. 2004 Jul 1;49(1):3-16. doi: 10.1016/j.femsec.2003.09.015. FEMS Microbiol Ecol. 2004. PMID: 19712379 Review.
-
Adsorption and desorption of chlorpyrifos to soils and sediments.Rev Environ Contam Toxicol. 2012;215:123-75. doi: 10.1007/978-1-4614-1463-6_3. Rev Environ Contam Toxicol. 2012. PMID: 22057931 Review.
Cited by
-
Leaching of phage from Class B biosolids and potential transport through soil.Appl Environ Microbiol. 2006 Jan;72(1):665-71. doi: 10.1128/AEM.72.1.665-671.2006. Appl Environ Microbiol. 2006. PMID: 16391105 Free PMC article.
-
Upscaling Transport of Bacillus subtilis Endospores and Coliphage phiX174 in Heterogeneous Porous Media from the Column to the Field Scale.Environ Sci Technol. 2021 Aug 17;55(16):11060-11069. doi: 10.1021/acs.est.1c01892. Epub 2021 Jul 28. Environ Sci Technol. 2021. PMID: 34318669 Free PMC article.
-
Physiological characteristics, geochemical properties and hydrological variables influencing pathogen migration in subsurface system: What we know or not?Geosci Front. 2022 Nov;13(6):101346. doi: 10.1016/j.gsf.2021.101346. Geosci Front. 2022. PMID: 37521131 Free PMC article.
-
Presence of bacteria in aqueous solution influences virus adsorption on nanoparticles.Environ Sci Pollut Res Int. 2013 Nov;20(11):8245-54. doi: 10.1007/s11356-013-1802-y. Epub 2013 May 22. Environ Sci Pollut Res Int. 2013. PMID: 23695855
-
Monitoring bacterial transport by stable isotope enrichment of cells.Appl Environ Microbiol. 2000 Nov;66(11):4935-9. doi: 10.1128/AEM.66.11.4935-4939.2000. Appl Environ Microbiol. 2000. PMID: 11055946 Free PMC article.
References
-
- Ackermann H W, Michael S D. Viruses of prokaryotes. Boca Raton, Fla: CRC Press; 1987. pp. 173–201.
-
- Bales R C, Li S, Maguire K M, Yahya M T, Gerba C P. MS-2 and poliovirus transport in porous media: hydrophobic effects and chemical perturbations. Water Resour Res. 1993;29:957–963.
-
- Bohn H, McNeal B L, O’Connor G. Soil chemistry. New York, N.Y: Wiley; 1979.
-
- Brown T L, LeMay H E., Jr . Chemistry—the central science. Englewood Cliffs, N.J: Prentice-Hall, Inc.; 1977. p. 319.
-
- Corapcioglu M Y, Haridas A. Transport and fate of microorganisms in porous media, a theoretical investigation. J Hydrol. 1984;72:149–169.
Publication types
MeSH terms
LinkOut - more resources
Full Text Sources
Other Literature Sources
Molecular Biology Databases
Research Materials
Miscellaneous
