

Determination of bacterial cell dry mass by transmission electron microscopy and densitometric image analysis
- PMID: 9464409
- PMCID: PMC106103
- DOI: 10.1128/AEM.64.2.688-694.1998
Determination of bacterial cell dry mass by transmission electron microscopy and densitometric image analysis
Abstract
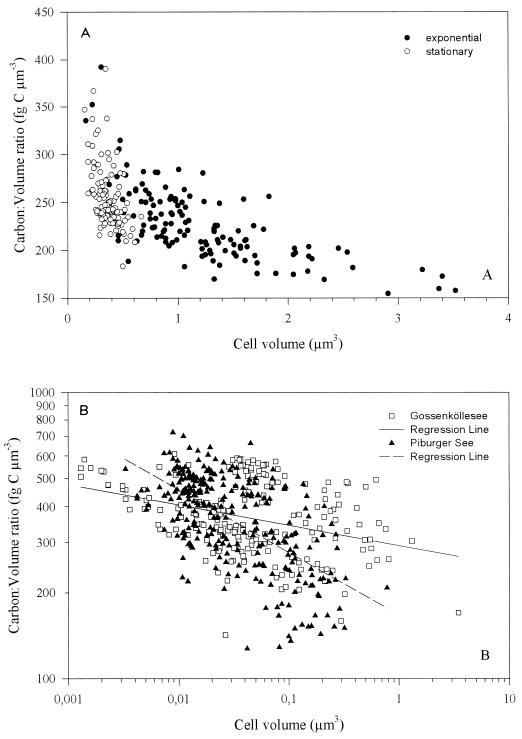
We applied transmission electron microscopy and densitometric image analysis to measure the cell volume (V) and dry weight (DW) of single bacterial cells. The system was applied to measure the DW of Escherichia coli DSM 613 at different growth phases and of natural bacterial assemblages of two lakes, Piburger See and Gossenköllesee. We found a functional allometric relationship between DW (in femtograms) and V (in cubic micrometers) of bacteria (DW = 435.V0.86); i.e., smaller bacteria had a higher ratio of DW to V than larger cells. The measured DW of E. coli cells ranged from 83 to 1,172 fg, and V ranged from 0.1 to 3.5 micron 3 (n = 678). Bacterial cells from Piburger See and Gossenköllesee (n = 465) had DWs from 3 fg (V = 0.003 micron 3) to 1,177 fg (V = 3.5 microns3). Between 40 and 50% of the cells had a DW of less than 20 fg. By assuming that carbon comprises 50% of the DW, the ratio of carbon content to V of individual cells varied from 466 fg of C micron-3 for Vs of 0.001 to 0.01 micron3 to 397 fg of C micron3 (0.01 to 0.1 micron3) and 288 fg of C micron3 (0.1 to 1 micron 3). Exponentially growing and stationary cells of E. coli DSM 613 showed conversion factors of 254 fg of C micron-3 (0.1 to 1 micron3) and 211 fg of C micron-3 (1 to 4 micron3), respectively. Our data suggest that bacterial biomass in aquatic environments is higher and more variable than previously assumed from volume-based measurements.
Figures


References
-
- Bahr G F, Zeitler E. The determination of the dry mass in populations of isolated particles. Lab Invest. 1965;14:955–977. - PubMed
Publication types
MeSH terms
LinkOut - more resources
Full Text Sources
Other Literature Sources
Molecular Biology Databases
