. 1998 Mar 1;18(5):1679-92.
doi: 10.1523/JNEUROSCI.18-05-01679.1998.

Cytoskeletal actin gates a Cl- channel in neocortical astrocytes

Affiliations

Cytoskeletal actin gates a Cl- channel in neocortical astrocytes

C D Lascola et al. J Neurosci. .

Abstract

Increases in astroglial Cl- conductance accompany changes in cell morphology and disassembly of cytoskeletal actin, but Cl- channels underlying these conductance increases have not been described. We characterize an outwardly rectifying Cl- channel in rodent neocortical cultured astrocytes and describe how cell shape and cytoskeletal actin modulate channel gating. In inside-out patch-clamp recordings from cultured astrocytes, outwardly rectifying Cl- channels either were spontaneously active or inducible in quiescent patches by depolarizing voltage steps. Average single-channel conductance was 36 pS between -60 and -80 mV and was 75 pS between 60 and 80 mV in symmetrical (150 mM NaCl) solutions. The permeability ratio (PNa/PCl) was 0.14 at lower ionic strength but increased at higher salt concentrations. Both ATP and 4, 4-diisothiocyanostilbene-2,2'-disulfonic acid produced a flicker block, whereas Zn2+ produced complete inhibition of channel activity. The frequency of observing both spontaneous and inducible Cl- channel activity was markedly higher in stellate than in flat, polygonally shaped astrocytes. In addition, cytoskeletal actin modulated channel open-state probability (PO) and conductance at negative membrane potentials, controlling the degree of outward rectification. Direct application of phalloidin, which stabilizes actin, preserved low PO and promoted lower conductance levels at negative potentials. Lower PO also was induced by direct application of polymerized actin. The actions of phalloidin and actin were reversed by coapplication of gelsolin and cytochalasin D, respectively. These results provide the first report of an outwardly rectifying Cl- channel in neocortical astrocytes and demonstrate how changes in cell shape and cytoskeletal actin may control Cl- conductance in these cells.


Figures
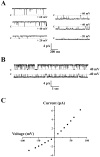
Fig. 1.
Fig. 1.
Outwardly rectifying Clchannel (ORCC) activity in inside-out patches from cultured rat astrocytes. ORCCs either were spontaneously active or required high-voltage pulses for activation (see Results) when patches were excised in symmetrical 150 mm NaCl solutions.A, Noncontiguous current traces of the ORCC at 1 sec intervals at membrane potentials from −60 to 60 mV in 20 mV increments. The channel from which these traces were obtained was activated after the patch potential was stepped to 60 mV for 45 sec. The C adjacent to the dotted lineindicates the closed state of the channel. B, Current traces of 10 sec from which the −40 and 40 mV traces were taken inA are displayed to illustrate channel activity over an extended period of time. C, Single-channelI–V plot demonstrating the outward rectification of the channel. Slope conductance was 36 pS between −80 and −60 mV and was 75 pS between 60 and 80 mV.
Fig. 2.
Fig. 2.
Depolarization-dependent inactivation of the ORCC.A, Amplitude histograms of current traces at −40 and 40 mV that were shown in Figure 1B. The histograms were fit with second-order gaussians. Mean current at 40 mV was 2.9 pA and at −40 mV was 1.75 pA, indicating a single conductance level of 72 and 44 pS at 40 and −40 mV, respectively. B, Depolarization-induced inactivation is shown in a graph ofPO versus membrane potential (mV) for the channel shown in Figure 1. PO within the first second (instantaneous PO) versus mV is shown by the filled circles. Steady-state availability is indicated by the filled squares.C, Current records taken from the channel in Figure 1show the channel first being stepped from 0 to 80 mV and then from 80 to 30 mV. The voltage protocol is shown above the current traces. At 80 mV (the top current trace), the channel at first has high open-state probability (PO) before inactivating <1 sec after the voltage step has been made. The channel thereafter remained inactivated for 30 sec (the remainder of the record is not displayed). Then the patch was stepped from 80 to 30 mV and the channel was reopened, maintaining a high PO.D, Whole-cell Cl currents in astrocytes transformed in warm Ringer’s solution (Lascola and Kraig, 1996) into a stellate morphology also demonstrate voltage-dependent inactivation at positive potentials.
Fig. 3.
Fig. 3.
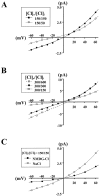
Cl selectivity of the ORCC.A, The selectivity of the ORCC was assessed by varying the internal concentration of Na and Cl ions. Initially, the patch was bathed in symmetrical 150 mm NaCl solutions. TheI–V relationship in these solutions reverses at 0 mV and is indicated by the filled circles. Then the bath was switched to one containing only 50 mm NaCl (unfilled circles) while the patch solution was held constant. The reversal potential for three patches that followed this solution change was −20 ± 0.7 mV (predicted NernstCl= −28 mV), suggesting aPNa/PCl of ∼0.14. B, I–V relationships demonstrating shifts in reversal potential after bath solution changes from 300 to 600 mm NaCl (unfilled circles) and from 300 to 150 mm NaCl (unfilled squares) while holding the pipette constant at 300 mm NaCl. The I–V relationship when 300 mm NaCl was present in both the bath and pipette is shown by the filled circles. When the bath was switched first to 600 mm NaCl, the zero current potential shifted to 11.2 ± 0.8 mV (n = 4; predicted NernstCl = 17 mV), indicating aPNa/PCl of 0.18. After the bath was switched to 150 NaCl, the mean reversal was −12.0 ± 0.6 mV (n = 4; predicted NernstCl = −17 mV), and thePNa/PClwas ∼0.2. C, Comparison of the I–Vrelationship in 150 mm NaCl solutions (filled circles) with one obtained in symmetrical 150 NMDG–Cl solutions (n = 12; unfilled circles). In the Na-free solutions, note the decrease in both inward and outward current amplitude, although the Cl concentrations remain the same.
Fig. 4.
Fig. 4.
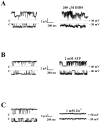
Block by DIDS, ATP, and Zn2+.A, Channel inhibition of 200 μm DIDS 1 min after application to the intracellular face of the patch (n = 3). DIDS produced a flickering block that was voltage-independent and irreversible. B, Channel inhibition by 2 mm ATP immediately after its addition to the intracellular/bath solution (n = 3). ATP produced an increase in open channel noise, especially at negative potentials. Some flicker block (rapid, complete closures) also was evident. Block was also voltage-independent but, in this case, completely reversible after washout of the nucleotide.C, The addition of 1 mmZn2+ completely abolished single-channel currents in <1 min (n = 3). This effect was reversible, but only after several minutes of washout. The C adjacent to the dotted line indicates the closed state of the channel.
Fig. 5.
Fig. 5.
Morphology-dependent expression of the ORCC. Shown is the percentage of expression of both spontaneous and induced Cl channel activity in excised and cell-attached patches, which differed between polygonal cells and stellate cells. Percentages represent the cumulative proportion of patches expressing Cl channels. In excised inside-out recordings, spontaneously active channels were more than three times as likely to be observed in patches excised from stellate cells (19%) than from polygonal cells (5%) (n = 91). When a standardized voltage activation protocol was used, depolarization-induced Cl channel activity was also greater in patches from stellate cells (81%), as compared with polygonal cells (58%).
Fig. 6.
Fig. 6.
Spontaneous low-to-highPO transition at negative potentials. A lowPO state at negative potentials was observed transiently in approximately one-third of outward rectifiers in inside-out patches. A, The two current traces on theleft represent an ORCC at 40 and −40 mV within the first minute after channel activation (after a 30 sec, 60 mV voltage pulse). Channel PO at 40 mV was 0.82.PO at −40 mV, in contrast, was 0.14. At lowPO, channel openings at −40 occurred only in brief bursts, separated by long closures. Theright current traces represent the same channel at 40 and −40 mV 1 min later. PO at 40 mV was 0.87, which was only slightly higher than POat this potential 1 min earlier. PO at −40 mV, however, increased dramatically to 0.76. The long and short closures of the channel at −40 mV now more closely resembled those at 40 mV above. The C adjacent to the dotted line indicates the closed state of the channel.B, Representative amplitude histograms of theleft and right current traces at −40 mV shown in A. The small open peak (at 1.7 pA) in theleft histogram indicates a peak conductance of 44 pS. The right histogram demonstrates both the increase inPO at −40 mV and the increase in channel conductance after this transition in PO. Peak conductance was 51 pS. The black arrow pointing to the right current trace in A calls attention to the brief transition to the former peak conductance level seen 1 min earlier. This conductance sublevel is represented by the 44 pS peak in the right histogram.
Fig. 7.
Fig. 7.
Closed, open, and burst time distributions at low and high PO. A,Left and right histograms represent the distribution of closed events for the −40 mV traces of the channel displayed in Figure 6. Both histograms were fit with second-order exponentials. The two time constants displayed within the histograms represent the mean times of the group of short closures (τS) and long closures (τL). For 26 control patches, mean τS = 3.0 ± 0.4 msec and τL = 21 ± 1.4 msec. Thus, the spontaneous transition from low-to-high PO in theleft and right current traces inA involved primarily a change in the long group of channel closures. B, Left andright histograms graph the distribution of open events at −40 mV before and after the transition inPO. Second-order exponential fits suggested two channel open states. For control patches, τS = 3.6 ± 0.3 msec and τL = 75 ± 3.9 msec (n = 26). Thus, the low-to-high transition inPO arose principally from a change in the long open state. C, The left andright histograms represent the distribution of channel bursts at −40 mV for the transition between low and highPO. As with open and closed states, the burst distribution histograms could be fit accurately with a second-order exponential. The shorter group of bursts (τ1) and the longer group of bursts (τ2) were 121 ± 16 and 2777 ± 181 msec, respectively. Thus, the spontaneous transition from low-to-highPO appears to arise mainly from an increase in the longer group of bursts, although an increase in the short burst lengths also was evident.
Fig. 8.
Fig. 8.
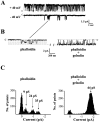
Phalloidin and gelsolin modulatePO and conductance. A, Current traces from a patch excised in the presence of 5 μm phalloidin. In 11 patches exposed to phalloidin, channels at negative potentials remained fixed at lowPO. B, A black line is drawn from a short burst of channel openings to a current trace that expands the short burst both in amplitude and time. The top dotted line (labeled C) represents the closed state of the channel. The next three dotted lines from top to bottomrepresent three different channel subconductance levels. The current trace on the right represents the same channel at −40 mV after the application (1 U/ml) of the actin-severing protein gelsolin. Note the marked increase in channelPO. The peak amplitude of the current trace on the right is indicated by the bottom dotted line. This line also is reproduced as the lowest dotted line in the left current trace before gelsolin addition. C, Amplitude histograms plot the change in conductance for the channel in the presence of phalloidin and after the subsequent addition of gelsolin. Note the clear delineation of three conductance levels (9, 24, and 35 pS) in the lefthistogram. Peak conductance in the presence of phalloidin was 35 pS. The right histogram shows the change in conductance after the addition of gelsolin. Peak conductance increased to 44 pS with increasing PO, and conductance sublevels were no longer evident.
Fig. 9.
Fig. 9.
PO and conductance levels in the presence of phalloidin and phalloidin plus gelsolin. These two graphs show the cumulative data from 15 control, 7 phalloidin, and 5 phalloidin plus gelsolin experiments from which complete I–V plots were obtained. Membrane potentials >40 mV were excluded to avoid the confounding influence of depolarization-dependent inactivation on PO.A, Plot of PO versus membrane potential (mV) showing the decrease in PO at negative potentials and the statistically insignificant decrease inPO at positive potentials in the presence of phalloidin (filled squares), as compared with control patches (filled circles). The actin-severing protein gelsolin (unfilled squares) reverses the effects of phalloidin at negative potentials.B, I–V plot reconstructed from the single-channel data shown in Figure 8. In the presence of phalloidin, mean conductance levels for all patches were 8.8 ± 0.2 (n = 4), 25.0 ± 0.3 (n = 9), 35 ± 0.7 (n = 8), and 44 ± 0.6 (n = 11). In this particular cell the peak level of conductance at −40 mV was 35 pS (filled circles). After the addition of gelsolin, peak conductance increased to 44 pS (unfilled circles). Each conductance level within the negative voltage range was well fit by linear regression via the expected reversal of the Clchannel in symmetrical solutions. Dotted lines from the regressions are extended into the positive voltage range to illustrate the different degrees of I–V rectification at the level of the single channel as it transitions between different conductance sublevels at negative potentials.
Fig. 10.
Fig. 10.
Actin and cytochalasin D modulatePO at negative potentials. A, The left current traces are taken from a patch initially in control solutions. PO at 40 mV was 0.74;PO at −40 mV was 0.71. Theright current traces demonstrate records of the same channel ∼5 min after the addition of a mixed solution of actin polymers, short filaments, and monomers (final concentration, 1 mg/ml). Actin caused a dramatic decrease in PO at negative potentials. PO at −40 mV was 0.05 over 30 sec, whereas at 40 mV PO was 0.69 after the addition of actin. B, The current trace on theleft represents an outwardly rectifying channel at −40 mV after it had been exposed to 1 mg/ml actin.PO at −40 mV was 0.23. The current trace on the right shows the same channel 17 min after the addition of 10 mm cytochalasin D while the amount of actin in the bath remained unchanged. Channel POincreased to 0.95. Note also the marked increase in open channel noise accompanying the increase in PO. TheC adjacent to the dotted line indicates the closed state of the channel. C,PO is plotted versus membrane potential (mV). Note that the increase in PO after the addition of cytochalasin D (unfilled squares) surpasses the PO of control patches. MeanPO at −40 mV after the addition of cytochalasin D was 0.89 ± 0.02 (n = 5), significantly higher (p < 0.05) than thePO (0.70 ± 0.04) in control cells.

Similar articles

Cited by

References

    1. Bormann J, Kettenmann H. Patch-clamp study of GABA receptor Cl channels in cultured astrocytes. Proc Natl Acad Sci USA. 1988;85:9336–9340. - PMC - PubMed
    1. Cantiello HF, Stow J, Prat AG, Ausiello DA. Actin filaments control epithelial Na channel activity. Am J Physiol. 1991;261:C882–C888. - PubMed
    1. Chesler M. The regulation and modulation of pH in the nervous system. Prog Neurobiol. 1990;34:401–427. - PubMed
    1. Colquhoun D, Hawkes AG. On the stochastic properties of single ion channels. Proc R Soc Lond [Biol] 1981;211:205–235. - PubMed
    1. Cooper JA. Effects of cytochalasin and phalloidin on actin. J Cell Biol. 1987;105:1473–1478. - PMC - PubMed

Publication types

MeSH terms