

doi: 10.1073/pnas.95.4.1490.
Is the molten globule a third phase of proteins?
Affiliations
- PMID: 9465042
- PMCID: PMC19058
- DOI: 10.1073/pnas.95.4.1490
Item in Clipboard
Is the molten globule a third phase of proteins?
Proc Natl Acad Sci U S A.
.
Abstract
The equilibrium properties of proteins are studied by Monte Carlo simulation of two simplified models of protein-like heteropolymers. These models emphasize the polymeric entropy of the fluctuating polypeptide chain. Our calculations suggest a generic phase diagram that contains a thermodynamically distinct "molten globule" state in addition to a rigid native state and a nontrivial unfolded state. The roles of side-chain packing and loop entropy are discussed.
Figures
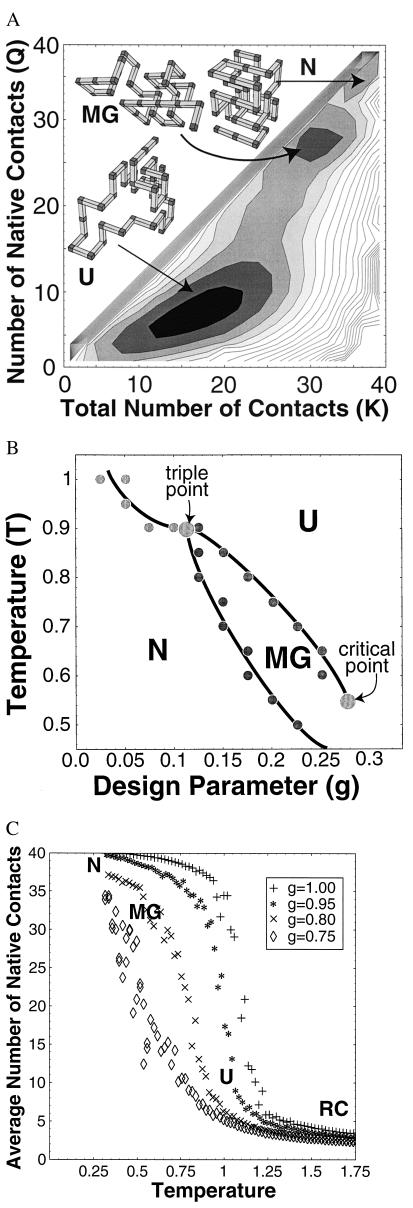
Lattice model results. See ¶, for simulation details. (A) Free energy. Free energy G(Q, K) vs. the number of native contacts Q and the total number of contacts K for a lattice 36-mer near the triple point (temperature T = 0.95 and design parameter g = 0.1), computed by Monte Carlo sampling.¶ In this experiment, temperature is measured in units of the average free energy of a native contact (which itself depends on temperature and denaturant concentration). The free energy surface exhibits three distinct local minima separated by barriers, corresponding to the U, MG, and N states. Typical conformations are shown for each. (B) Phase diagram. Phase diagram of the lattice model vs. temperature T and design parameter g. The parameter g models perturbations that nonspecifically destabilize the N state, crudely modeling changes in pH and denaturant concentration. All transitions are first order. There is a triple point at T* = 0.9 and g* = 0.1. For T > T* or g < g*, the MG is never globally stable. Finally, our simulations suggest that the line of first-order (cooperative) transitions between MG and U ends at a critical point at Tc = 0.55 and gc = 0.28. (C) Cooperativity of the U ⇌ MG transition. To study the cooperativity of U from the MG, we calculated the average number of native contacts Q vs. temperature T for several different values of design parameter g. As g increases (modeling the addition of denaturant), the transition becomes less cooperative, while simultaneously stabilizing the MG. These competing effects of denaturant may reconcile the disagreement between experimental studies of the U ⇌ MG transition, which report both cooperative (5) and noncooperative (7) transitions in different proteins under different conditions.
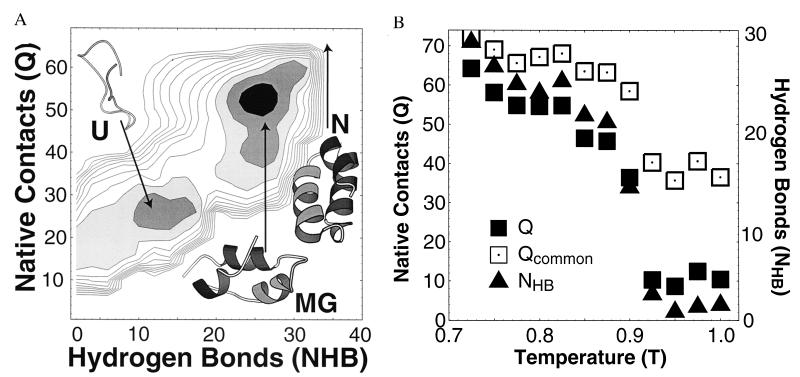
Off-lattice model results. (A) Free energy. The free energy G(NHB, Q) at T = 0.6 for an off-lattice model of fragment B of protein A has two minima (MG/N and U). (Temperature is measured in units of the free energy of a native contact.) As temperature decreases, the MG minima smoothly shifts toward the N state, N (Q = 72, NHB = 21). Typical conformations from each minima are shown, as well as the N state. In contrast with the lattice simulation, the absence of side-chain packing in the off-lattice model eliminates the barrier between the N and MG phases that is found in the lattice model. (B) Temperature dependence. Plot of 〈Q〉, 〈NHB〉, and 〈Qcommon〉 vs. temperature T. 〈Qcommon〉 is the typical number of native contacts in common between four conformations chosen from an equilibrium ensemble and thus describes the degree to which the contacts are fluctuating. The small value of 〈Qcommon〉/〈Q〉 in the U state implies large fluctuations—in contrast with the folded state, in equilibrium the “native” contacts present in U conformations vary greatly from conformation to conformation. In our model, 〈NHB〉 measures α-helical content, and Qmax − 〈Q〉 corresponds crudely to solvent exposure.
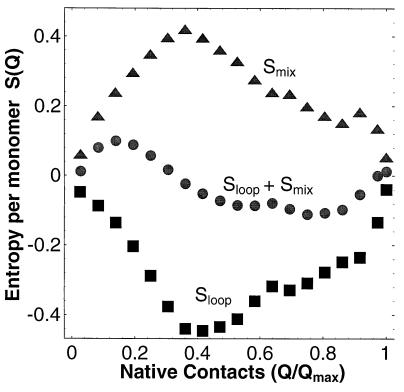
Entropy of lattice model. Mixing (triangles) and loop (squares) entropies as a function of the number of N contacts Q of the lattice 36-mer at T = 1 and g = 0. The free energy barrier at intermediate Q and the U free energy minima at nonzero Q are the result of the interplay of these two entropies, as shown by the respective entropic minima and maxima in Sloop + Smix.
References
-
- Privalov P L. Adv Prot Chem. 1979;33:167–241. - PubMed
-
- Creighton T E. Protein Folding. New York: Freeman; 1992.
-
- Ptitsyn O B. Advances in Protein Chemistry. 1995;47:83–229. - PubMed
-
- Ptitsyn O B, Uversky V N. FEBS Lett. 1994;341:15–18. - PubMed
-
- Kuwajima K. Prot Struct Funct Genet. 1989;6:87–103. - PubMed
Publication types
MeSH terms
Substances
LinkOut - more resources
Full Text Sources
