. 1998 Feb 17;95(4):1556-61.
doi: 10.1073/pnas.95.4.1556.

Monitoring conformational dynamics of a single molecule by selective fluorescence spectroscopy

Affiliations

Monitoring conformational dynamics of a single molecule by selective fluorescence spectroscopy

C Eggeling et al. Proc Natl Acad Sci U S A. .

Abstract

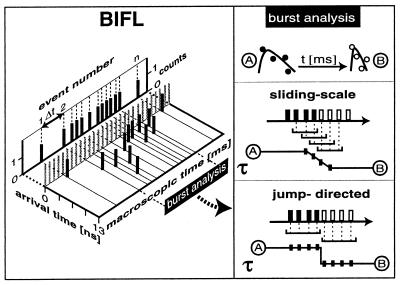
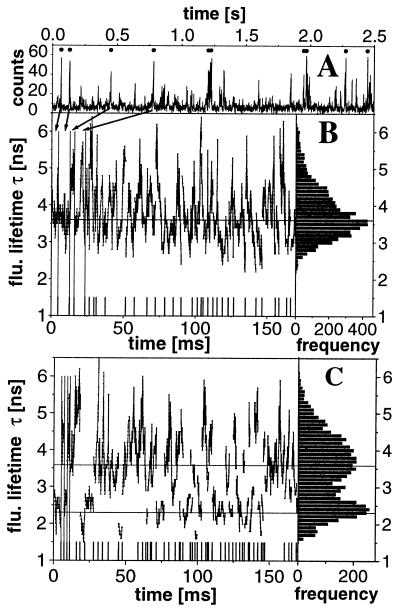
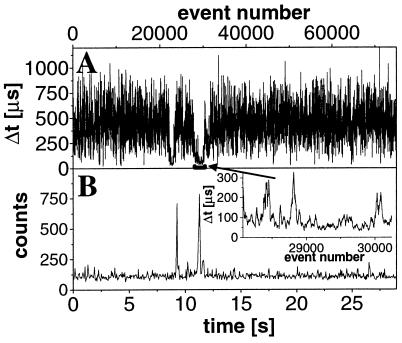
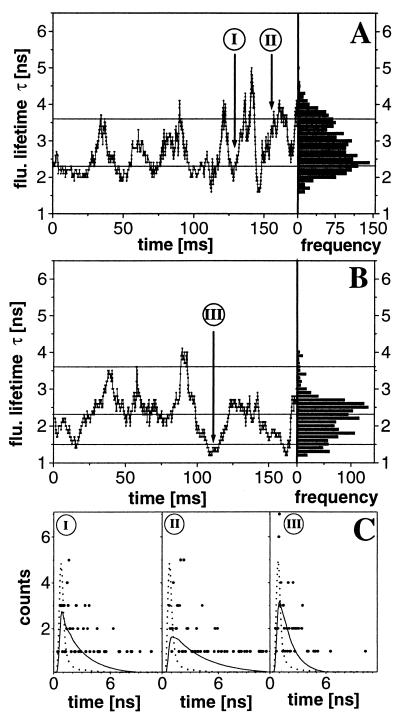
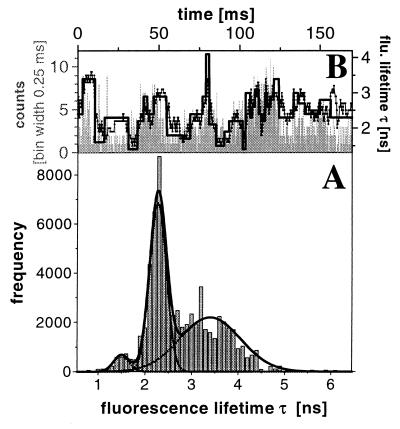
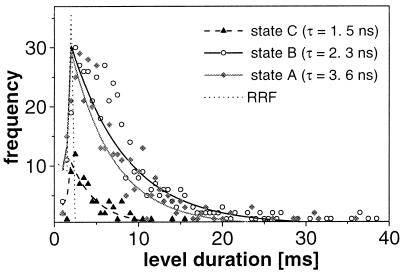
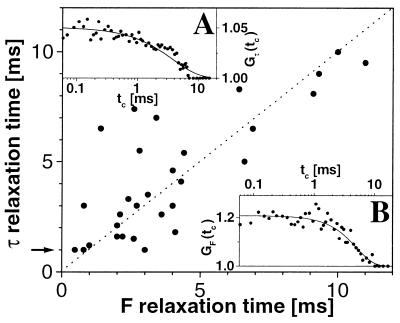
A recently developed, real-time spectroscopic technique, burst-integrated fluorescence lifetime (BIFL), is shown to be well suited for monitoring the individual molecular conformational dynamics of a single molecule diffusing through the microscopic, open measurement volume (approximately 10 fl) of a confocal epi-illuminated set-up. In a highly diluted aqueous solution of 20-mer oligonucleotide strand of DNA duplex labeled with the environment-sensitive fluorescent dye tetramethylrhodamine (TMR), fluorescence bursts indicating traces of individual molecules are registered and further subjected to selective burst analysis. The two-dimensional BIFL data allow the identification and detection of different temporally resolved conformational states. A complementary autocorrelation analysis was performed on the time-dependent fluctuations in fluorescence lifetime and intensity. The consistent results strongly support the hypothesized three-state model of the conformational dynamics of the TMR-DNA duplex with a polar, a nonpolar, and a quenching environment of TMR.


Figures

Figure 1
Figure 1
Principles of BIFL spectroscopy with a two-dimensional time measurement and techniques for the calculation of τ traces.
Figure 2
Figure 2
(A) Typical MCS trace (bin width 1 ms) of 1 pM R6G in water/glycerol (60/40 wt/wt). (B and C) τ traces and corresponding τ histograms (projection onto the y axis) of selected single-molecule bursts (marked by dots in A) as a function of the macroscopic time for a different number of fluorescent species. The vertical lines on the x axis indicate excised background signal between two bursts. (B) Single dye R6G (1 pM): τ = 3.7 ± 0.6 ns. (C) Equimolar mixture (1 pM) of RB (τ = 2.3 ± 0.3 ns) and R6G (τ = 3.8 ± 0.75 ns).
Figure 3
Figure 3
Two equivalent BIFL representations of a time-dependent signal trace of a single TMR-DNA duplex. (A) Plot of the time delay, Δt (averaged for 20 events), between consecutive photons versus the signal event number. (Inset) Fluorescence fluctuations within the burst. (B) MCS trace with a bin width of 50 ms calculated from the Δt trace in A.
Figure 4
Figure 4
Plot of τ traces with the corresponding τ histogram as a function of the macroscopic time of two individual TMR-DNA duplex molecules. (A) τ trace of events 28,075 to 30,243 in Fig. 3. The horizontal lines represent a lower and an upper τ level (2.3 and 3.6 ns). (B) τ trace with considerable shorter fluorescence lifetimes and three τ levels (1.5, 2.3, and 3.6 ns). (C) Three typical fluorescence decays, I, II, and III, (indicated by arrows in A and B). Instrument response function (dotted line) and fit (bold line) by MLE (Eq. 1): τ(I) = 2.2 ns (background γ = 0.28), τ(II) = 3.7 ns (γ = 0.14), and τ(III) = 1.3 ns (γ = 0.20).
Figure 5
Figure 5
(A) Fluorescence lifetime distribution obtained by jump-directed analysis of 30 bursts containing 70,300 photons in 948 τ levels. (B) Direct correlation of three data sets of a single burst: τ traces (right axis): jump-directed (bold line) and sliding-scale (dotted line); and MCS-trace (left axis, gray lines).
Figure 6
Figure 6
Frequency of τ level duration and calculated average relaxation times ρ of the three levels A, B, and C (ρA = 5.1 ms, ρB = 6.7 ms; ρC = 3.1 ms) obtained by convolution of a single-exponential decay with a recovery response function (RRF width 1.5 ms).
Figure 7
Figure 7
Comparison of the relaxation times obtained by F- and τ-autocorrelation analysis of the various bursts. The arrow on the y axis gives an estimate for the achievable time resolution of Gτ(tc) because of correlated statistical noise. (Insets) Normalized autocorrelation curves Gτ(tc) (A) and GF(tc) (B). Fit to Eq. 3 with a single relaxation correlation time ω. (A) ωτ = 4 ms, Gτ(0) = 0.04. (B) ωF = 5 ms, GF(0) = 0.22.
Figure 8
Figure 8
Model of three conformational states of the TMR-DNA duplex consistent with the results of BIFL spectroscopy.

References

    1. Eigen M, Rigler R. Proc Natl Acad Sci USA. 1994;91:5740–5747. - PMC - PubMed
    1. Nie S, Chiu D T, Zare R N. Anal Chem. 1995;67:2849–2857.
    1. Keller R A, Ambrose W P, Goodwin P M, Jett J H, Martin J C, Ming W. Appl Spectrosc. 1996;50:12–32.
    1. Goodwin P M, Ambrose W P, Keller R A. Acc Chem Res. 1996;29:607–613.
    1. Affleck R L, Ambrose W P, Demas J N, Goodwin P M, Schecker J A, Wu M, Keller R A. Anal Chem. 1996;68:2270–2276. - PubMed

Publication types

LinkOut - more resources