

Basal expression of cyclooxygenase-2 and nuclear factor-interleukin 6 are dominant and coordinately regulated by interleukin 1 in the pancreatic islet
- PMID: 9465095
- PMCID: PMC19191
- DOI: 10.1073/pnas.95.4.1788
Basal expression of cyclooxygenase-2 and nuclear factor-interleukin 6 are dominant and coordinately regulated by interleukin 1 in the pancreatic islet
Abstract
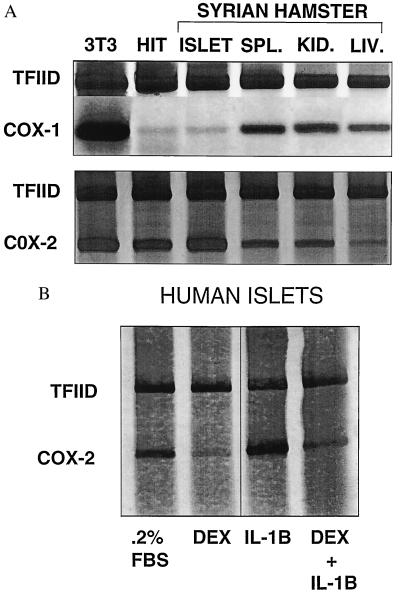
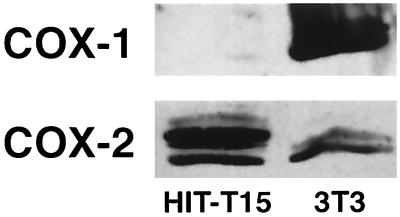
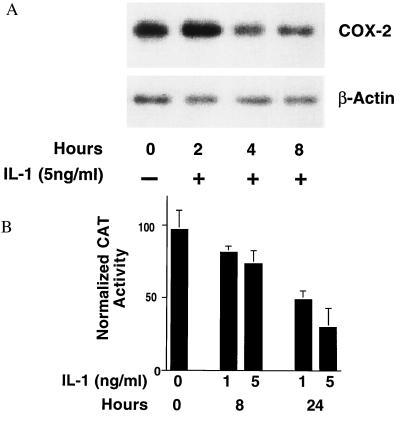
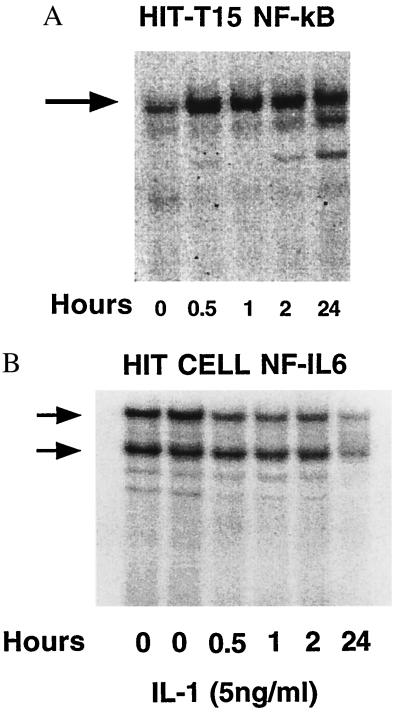
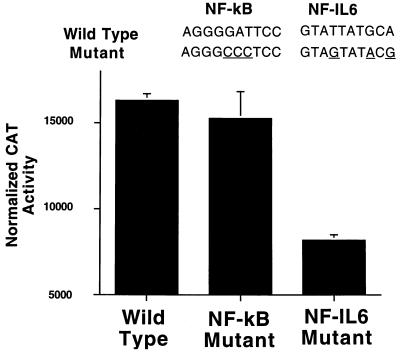
The enzyme cyclooxygenase (COX)-1 is constitutive whereas COX-2 is regulated in virtually all tissues. To assess whether this dogma holds true in the pancreatic islet, we examined basal and interleukin (IL)-1-regulated expression of COX-2 in HIT-T15 cells, Syrian hamster and human islets, and other Syrian hamster tissues. We found that COX-2, and not COX-1, gene expression is dominant in pancreatic islet tissue under both basal and IL-1-stimulated conditions. Control tissues (liver, spleen, and kidney) showed the expected predominance of COX-1 gene expression. Basal and IL-1-stimulated prostaglandin E2 synthesis were blocked by a specific COX-2 inhibitor. IL-1 stimulation had a biphasic effect on COX-2 mRNA levels with an initial mild increase at 2-4 hr followed by a more dramatic decrease below basal level by 24 hr. The IL-1-induced increase in COX-2 mRNA levels was accompanied by a parallel increase in NF-kappaB binding to COX-2 promoter elements. The subsequent decrease in COX-2 mRNA levels was accompanied by a parallel decrease in NF-IL-6 binding activity and COX-2 promoter activity. Specific mutation of the NF-IL-6 binding motif within the COX-2 promoter reduced basal promoter activity by 50% whereas mutation of the NF-kappaB motif had no effect. These studies provide documentation of NF-IL-6 in the pancreatic islet and that COX-2, rather than COX-1, is dominantly expressed. They suggest coordinate regulation by IL-1 of COX-2 mRNA, NF-kappaB, and NF-IL-6 and raise the issue of whether intrinsically high levels of COX-2 gene expression predisposes the normal islet for microenvironmentally induced overproduction of islet prostaglandin E2.
Figures

Similar articles
-
Inhibition of tumor necrosis factor alpha-induced prostaglandin E2 production by the antiinflammatory cytokines interleukin-4, interleukin-10, and interleukin-13 in osteoarthritic synovial fibroblasts: distinct targeting in the signaling pathways.Arthritis Rheum. 1999 Apr;42(4):710-8. doi: 10.1002/1529-0131(199904)42:4<710::AID-ANR14>3.0.CO;2-4. Arthritis Rheum. 1999. PMID: 10211885
-
Interleukin-1beta elevates cyclooxygenase-2 protein level and enzyme activity via increasing its mRNA stability in human endometrial stromal cells: an effect mediated by extracellularly regulated kinases 1 and 2.J Clin Endocrinol Metab. 2002 Jul;87(7):3263-73. doi: 10.1210/jcem.87.7.8594. J Clin Endocrinol Metab. 2002. PMID: 12107235
-
Induction of cyclooxygenase-2 gene in pancreatic beta-cells by 12-lipoxygenase pathway product 12-hydroxyeicosatetraenoic acid.Mol Endocrinol. 2002 Sep;16(9):2145-54. doi: 10.1210/me.2001-0300. Mol Endocrinol. 2002. PMID: 12198250
-
Involvement of CCAAT enhancer binding protein transcription factors in the regulation of prostaglandin G/H synthase 2 expression by interleukin-1 in osteoblastic MC3T3-E1 cells.J Bone Miner Res. 2000 Jun;15(6):1138-46. doi: 10.1359/jbmr.2000.15.6.1138. J Bone Miner Res. 2000. PMID: 10841183
-
Cyclooxygenase isozymes and their gene structures and expression.Prostaglandins Other Lipid Mediat. 2002 Aug;68-69:95-114. doi: 10.1016/s0090-6980(02)00024-2. Prostaglandins Other Lipid Mediat. 2002. PMID: 12432912 Review.
Cited by
-
Cyclooxygenase-2, not microsomal prostaglandin E synthase-1, is the mechanism for interleukin-1β-induced prostaglandin E2 production and inhibition of insulin secretion in pancreatic islets.J Biol Chem. 2012 Sep 14;287(38):32246-53. doi: 10.1074/jbc.M112.364612. Epub 2012 Jul 20. J Biol Chem. 2012. PMID: 22822059 Free PMC article.
-
The role of prostaglandins in allergic lung inflammation and asthma.Expert Rev Respir Med. 2015 Feb;9(1):55-72. doi: 10.1586/17476348.2015.992783. Epub 2014 Dec 26. Expert Rev Respir Med. 2015. PMID: 25541289 Free PMC article. Review.
-
Hepatitis C virus core protein suppresses NF-kappaB activation and cyclooxygenase-2 expression by direct interaction with IkappaB kinase beta.J Virol. 2005 Jun;79(12):7648-57. doi: 10.1128/JVI.79.12.7648-7657.2005. J Virol. 2005. PMID: 15919917 Free PMC article.
-
PTGS-2-PTGER2/4 signaling pathway partially protects from diabetogenic toxicity of streptozotocin in mice.Diabetes. 2012 Jul;61(7):1879-87. doi: 10.2337/db11-1396. Epub 2012 Apr 20. Diabetes. 2012. PMID: 22522619 Free PMC article.
-
Interferon regulatory factor (IRF)-1 and IRF-2 regulate interferon gamma-dependent cyclooxygenase 2 expression.J Exp Med. 2000 Jun 19;191(12):2131-44. doi: 10.1084/jem.191.12.2131. J Exp Med. 2000. PMID: 10859338 Free PMC article.
References
Publication types
MeSH terms
Substances
Grants and funding
LinkOut - more resources
Full Text Sources
Research Materials
