. 1998 Feb 17;95(4):1834-9.
doi: 10.1073/pnas.95.4.1834.

Calibrated functional MRI: mapping the dynamics of oxidative metabolism

Affiliations

Calibrated functional MRI: mapping the dynamics of oxidative metabolism

T L Davis et al. Proc Natl Acad Sci U S A. .

Abstract

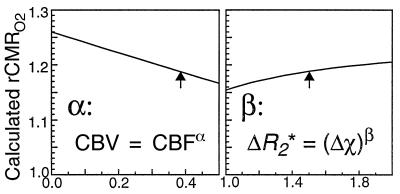
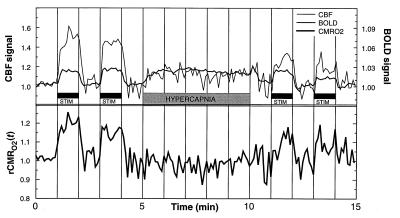
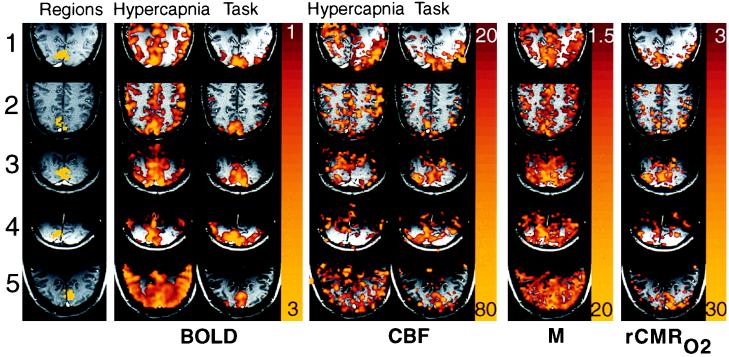
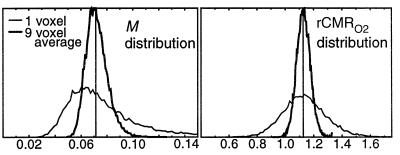
MRI was extended to the measurement of changes in oxidative metabolism in the normal human during functionally induced changes in cellular activity. A noninvasive MRI method that is model-independent calibrates the blood oxygen level dependent (BOLD) signal of functional MRI (fMRI) against perfusion-sensitive MRI, using carbon dioxide breathing as a physiological reference standard. This calibration procedure provides a regional measurement of the expected sensitivity of the fMRI BOLD signal to changes in the cellular activity of the brain. Maps of the BOLD signal calibration factor showed regional heterogeneity, indicating that the magnitude of functionally induced changes in the BOLD signal will be dependent on both the local change in blood flow and the local baseline physiology of the cerebral cortex. BOLD signal magnitude is shown to be reduced by 32% from its expected level by the action of oxygen metabolism. The calibrated fMRI technique was applied to stimulation of the human visual cortex with an alternating radial checkerboard pattern. With this stimulus oxygen consumption increased 16% whereas blood flow increased 45%. Although this result is consistent with previous findings of a significant difference between the increase in blood flow and oxygen consumption, it does indicate clearly that oxidative metabolism is a significant component of the metabolic response of the brain to functionally induced changes in cellular activity.


Figures

Figure 1
Figure 1
Model dependency on design parameters. Ranges of calculated rCMRO2 were obtained by varying α and β through plausible values. The blood volume coupling exponent ∝ has been measured at 0.38 (22); Monte Carlo simulations show β ≅ 1.5 for our experiment. We used these values (arrows) for our analyses.
Figure 2
Figure 2
BOLD and CBF time courses normalized to the hypercapnia signal change, averaged across eight trials. Compared with hypercapnia-induced signal change, the CBF signal outstrips the BOLD signal changes during photic stimulation. rCMRO2 time course calculated from the same data shows metabolic response within seconds of photic stimulation onset. No temporal smoothing was done: all time points (6-s resolution) were collected and calculated independently. Note that by analytic design the average rCMRO2 during the hypercapnia period and baseline periods are both set to 1.
Figure 3
Figure 3
Maps from trial (A) of each subject from Table 1 show regional variations. The first column shows regions of interest in yellow superimposed on an anatomical image weighted for slow flow to highlight veins: note prominent sagittal sinuses. No venous structures were seen within the regions of interest. The second and third columns show BOLD hypercapnia and task activation responses as color overlays: colors represent signal increases from 1% (red) to 3% (yellow). The fourth and fifth columns show CBF hypercapnia and task activation increasing 20% to 80%, the calibration parameter M calculated from hypercapnia data alone is shown in color from 1.5% to 20%. The right-most column shows rCMRO2 for each subject, from 3% to 30%, calculated from M and task activation images. All subjects show a confluent patch of increased rCMRO2 averaging from 13% to 19% within visual cortex. Some peaks reach up to 30% increase in metabolism, corresponding to peaks of blood flow up to 70%.
Figure 4
Figure 4
Noise propagation simulation results, from Monte Carlo simulation with means and second order noise characteristics taken to match single voxel or nine voxel averages from the primary data. (BOLD and FAIR baseline SNR 100:1, FAIR perfusion signal component 4%). Although the maximum likelihood for the M estimate is skewed toward lower values, the bias is self-correcting in the estimate for rCMRO2, which shows no noise bias.

Similar articles

Cited by

References

    1. Raichle M E. In: Handbook of Physiology: The Nervous System V. Plum F, editor. Bethesda, MD: Am. Physiol. Soc.; 1987. pp. 643–674.
    1. Fox P T, Raichle M E. Proc Natl Acad Sci USA. 1986;83:1140–1144. - PMC - PubMed
    1. Fox P T, Raichle M E, Mintun M A, Dence C. Science. 1988;241:462–464. - PubMed
    1. Madsen P L, Hasselbalch S G, Hagemann L P, Olsen K S, Buelow J, Holm S, Wildschiodtz G, Paulson O B, Lassen N A. J Cereb Blood Flow Metab. 1995;15:485–491. - PubMed
    1. Roland P E, Eriksson L, Stone-Elander S, Widen L. J Neurosci. 1987;7:2373–2389. - PMC - PubMed