

Prevalence, detection, and management of cardiovascular risk factors in different ethnic groups in south London
- PMID: 9470870
- PMCID: PMC1892335
- DOI: 10.1136/hrt.78.6.555
Prevalence, detection, and management of cardiovascular risk factors in different ethnic groups in south London
Abstract
Objective: To assess the prevalence of cardiovascular risk factors and their level of detection and management in three ethnic groups.
Design: Population based survey during 1994 to 1996.
Setting: Former Wandsworth Health Authority in South London.
Subjects: 1578 men and women, aged 40 to 59 years; 524 white, 549 of African descent, and 505 of South Asian origin.
Main outcome measures: Age adjusted prevalence of hypertension, diabetes, obesity, raised serum cholesterol, and smoking.
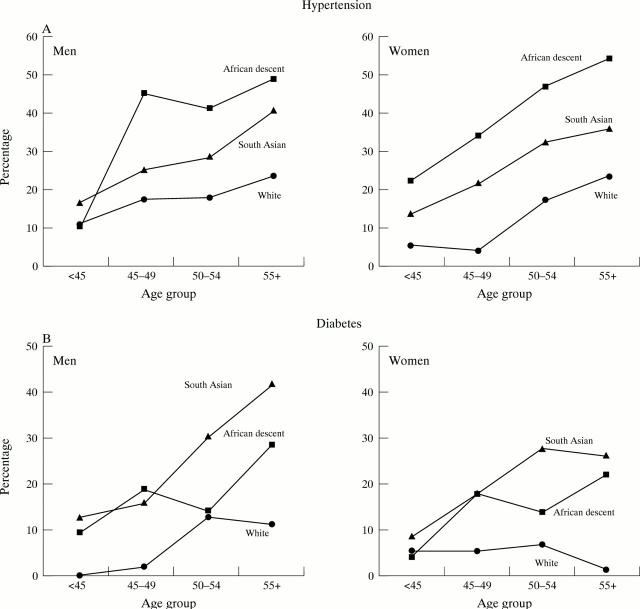
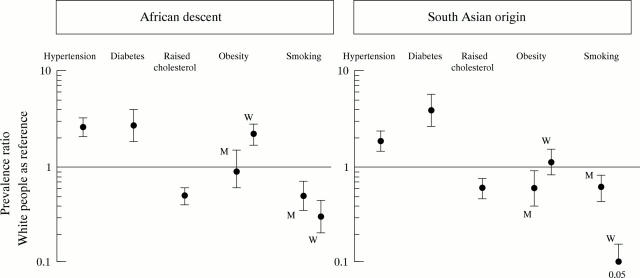
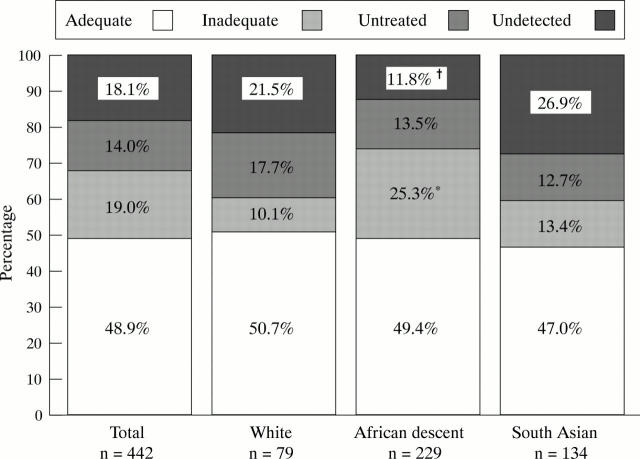
Results: Ethnic minorities of both sexes had raised prevalence rates of hypertension and diabetes compared to white people. Age and sex standardised prevalence ratios for hypertension were 2.6 (95% confidence interval 2.1 to 3.2) in people of African descent and 1.8 (1.4 to 2.3) in those of South Asian origin. For diabetes, the ratios were 2.7 (1.8 to 4.0) in people of African descent and 3.8 (2.6 to 5.6) in those of South Asian origin. Hypertension and diabetes were equally common among Caribbeans and West Africans and among South Asian Hindus and Muslims. Prevalence of severe obesity was high overall, but particularly among women of African descent (40% (35% to 45%)). In contrast, raised serum cholesterol and smoking rates were higher among white people. Of hypertensives, 49% (216 of 442) had adequate blood pressure control. Overall, 18% (80 of 442) of hypertensives and 33% (62 of 188) of diabetics were undetected before our survey. Hypertensive subjects of African descent appeared more likely to have been detected (p = 0.034) but less likely to be adequately managed (p = 0.085).
Conclusions: Hypertension and diabetes are raised two- to threefold in South Asians, Caribbeans, and West Africans in Britain. Detection, management, and control of hypertension has improved, but there are still differences between ethnic groups. Obesity is above the Health of the Nation targets in all ethnic groups, particularly in women of African descent. Preventive and treatment strategies for different ethnic groups in Britain need to consider both cultural differences and underlying susceptibility to different vascular diseases.
Figures
References
Publication types
MeSH terms
Substances
LinkOut - more resources
Full Text Sources
Medical