. 1998 Feb 23;140(4):821-9.
doi: 10.1083/jcb.140.4.821.

Rapid diffusion of green fluorescent protein in the mitochondrial matrix

Affiliations

Rapid diffusion of green fluorescent protein in the mitochondrial matrix

A Partikian et al. J Cell Biol. .

Abstract

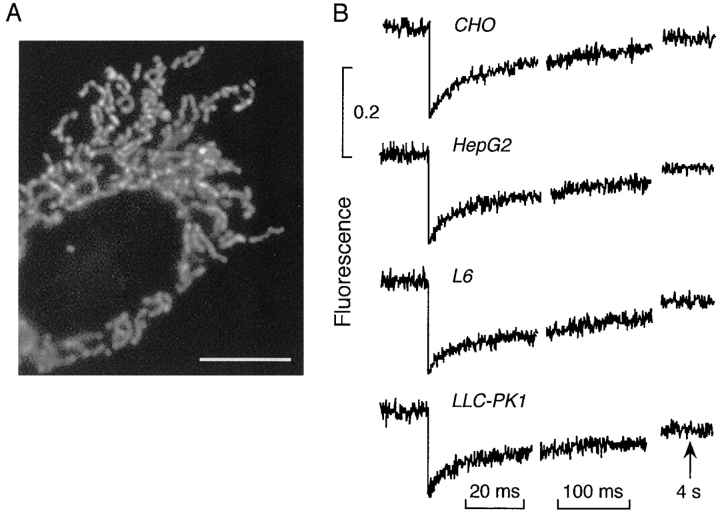
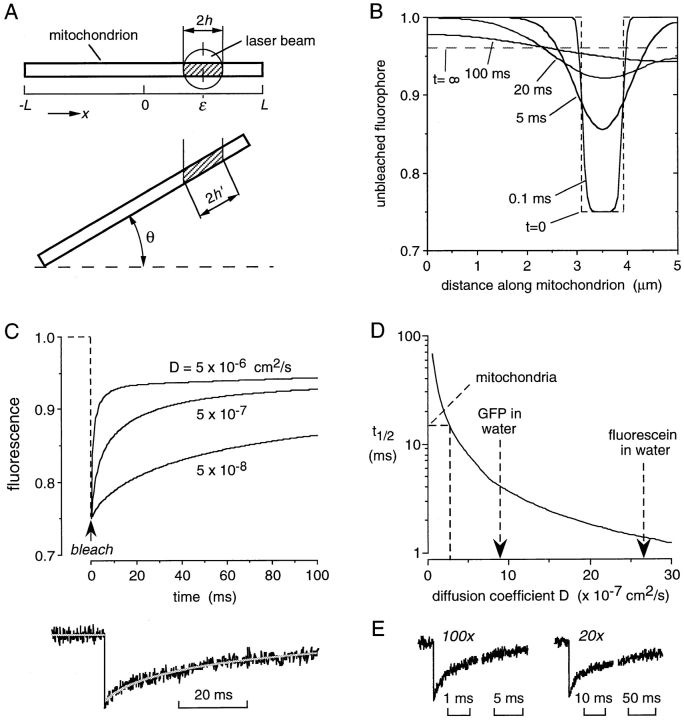
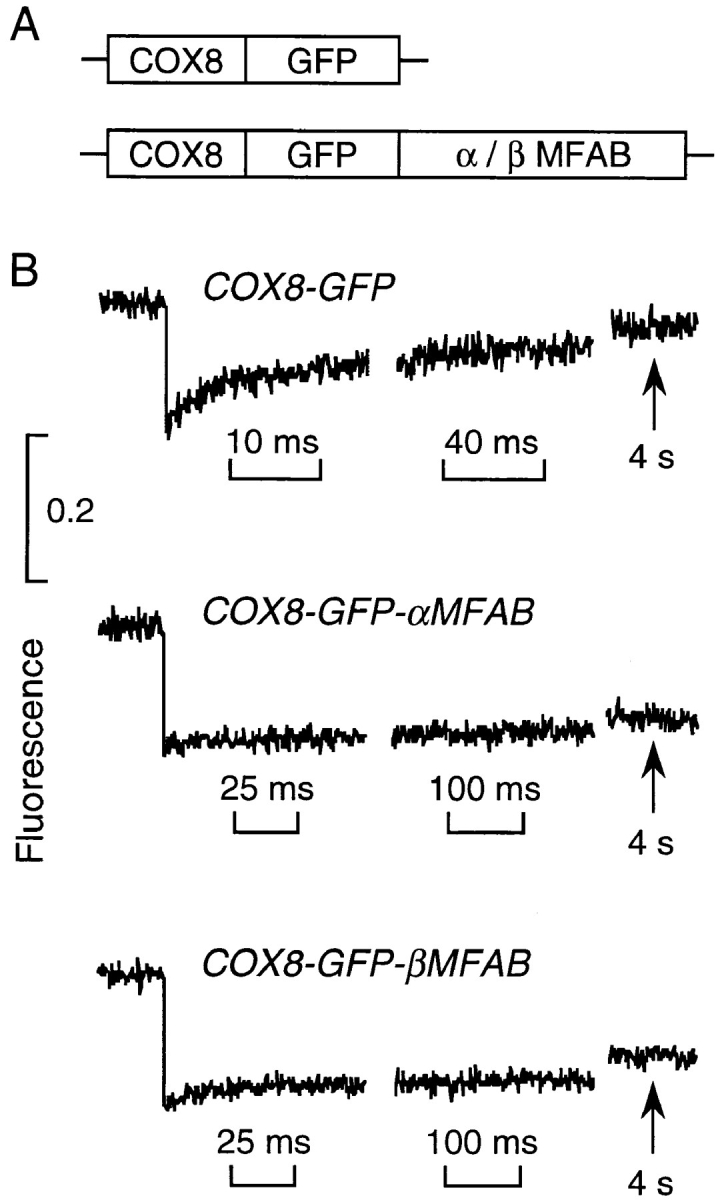
It is thought that the high protein density in the mitochondrial matrix results in severely restricted solute diffusion and metabolite channeling from one enzyme to another without free aqueous-phase diffusion. To test this hypothesis, we measured the diffusion of green fluorescent protein (GFP) expressed in the mitochondrial matrix of fibroblast, liver, skeletal muscle, and epithelial cell lines. Spot photobleaching of GFP with a 100x objective (0.8-micron spot diam) gave half-times for fluorescence recovery of 15-19 ms with >90% of the GFP mobile. As predicted for aqueous-phase diffusion in a confined compartment, fluorescence recovery was slowed or abolished by increased laser spot size or bleach time, and by paraformaldehyde fixation. Quantitative analysis of bleach data using a mathematical model of matrix diffusion gave GFP diffusion coefficients of 2-3 x 10(-7) cm2/s, only three to fourfold less than that for GFP diffusion in water. In contrast, little recovery was found for bleaching of GFP in fusion with subunits of the fatty acid beta-oxidation multienzyme complex that are normally present in the matrix. Measurement of the rotation of unconjugated GFP by time-resolved anisotropy gave a rotational correlation time of 23.3 +/- 1 ns, similar to that of 20 ns for GFP rotation in water. A rapid rotational correlation time of 325 ps was also found for a small fluorescent probe (BCECF, approximately 0.5 kD) in the matrix of isolated liver mitochondria. The rapid and unrestricted diffusion of solutes in the mitochondrial matrix suggests that metabolite channeling may not be required to overcome diffusive barriers. We propose that the clustering of matrix enzymes in membrane-associated complexes might serve to establish a relatively uncrowded aqueous space in which solutes can freely diffuse.


Figures

Figure 1
Figure 1
Spot photobleaching of GFP in the mitochondrial matrix. (A) Confocal fluorescence micrograph of CHO cells expressing GFP in mitochondria (100× objective, NA 1.4). (B) Photobleaching of GFP in the mitochondrial matrix of indicated cells. Measurements were done using a 100× objective (0.8-μm-diam spot) and 40 μs bleach time at 23°C. Each curve is the average of 10–15 fluorescence recovery curves from different cells. Bar, 5 μm.
Figure 2
Figure 2
Photobleaching of GFP-labeled mitochondria in CHO cells. (A) Photobleaching with 40 μs bleach time using indicated objectives. Corresponding spot diameters in the focal plane were 0.8 (100×), 1.3 (60×), and 4 μm (20×). (B) Photobleaching as in A. (100× objective) in cells after 6 h fixation in 4% paraformaldehyde. (C) Photobleaching (100× objective) with indicated bleach times. Laser intensity was adjusted to give 20–30% bleach depth. (D) Effect of mitochondrial configuration on GFP diffusion. Cells were incubated with PBS, an hypoosmolar solution (150 mOsm, 1:1 PBS/water), or an hyperosmolar solution (600 mOsm, PBS + 300 mM sucrose) for 5–15 min before bleaching. Each curve is the average of 10–15 fluorescence recovery curves from different cells.
Figure 3
Figure 3
Predictions of the model for solute diffusion in the mitochondrial matrix. (A) Model of mitochondria as a long thin cylinder with unobstructed lumen oriented at an angle θ. See text and Appendix for details. (B) Time evolution of unbleached fluorophore concentration along the mitochondrial axis. The initial bleach profile is shown as dashed lines. Mitochondrial length was 5 μm, laser spot diameter 0.8 μm and D of 5 × 10⁻⁷ cm2/s. (C) Model predictions for fluorescence recovery at different D for bleaching with 100× objective and short bleach time; bottom, data from CHO cells with fitted D of 2.6 × 10⁻⁷ cm2/s. Model parameters: L = 5 μm, h = 0.4 μm, θmax = 20 degrees. (D) Predicted dependence of measured t 1/2 for fluorescence recovery on diffusion coefficient. D values are indicated for GFP diffusion in mitochondria vs. water and for fluorescein in water. (E) Photobleaching of 1 μM fluorescein in PBS in a 0.5-μm inner diameter glass capillary tube using 25-μs bleach time and indicated objective.
Figure 4
Figure 4
Solute rotation in the mitochondrial matrix measured by time-resolved anisotropy. Phase-modulation plots of differential phase angle (filled circles) and modulation factor (open circles) as a function of modulation frequency. (A) GFP rotation in the mitochondrial matrix of CHO cells. Fitted curves correspond to a rotational correlation time of 21.4 ns (lifetime 2.5 ns, limiting anisotropy ro 0.4). Dashed curves shown for 15 and 35 ns correlation times. (B) Rotation of BCECF in the matrix of isolated liver mitochondria. Curves correspond to rotational correlation times of 0.35 and 46 ns with a fractional amplitude of the fast component of 0.56 (lifetime 3.6 ns, ro 0.392). Dashed curves shown for short correlation times of 0.2 and 0.6 ns.
Figure 5
Figure 5
Translational diffusion of GFP in fusion with two soluble matrix enzymes. (A) Fusion constructs containing the targeting presequence of subunit VIII of human cytochrome c oxidase (COX8) and the αMFAB and βMFAB. See text for explanations. (B) Photobleaching of transfected CHO cells was carried out under the conditions as in Fig. 1. Each curve is the average of 10–15 fluorescence recovery curves from different cells.

Similar articles

Cited by

References

    1. Axelrod D, Koppel DE, Schlessinger J, Elson E, Webb WW. Mobility measurement by analysis of fluorescence photobleaching recovery kinetics. Biophys J. 1976;16:1055–1069. - PMC - PubMed
    1. Bicknese S, Periasamy N, Shohet SB, Verkman AS. Cytoplasmic viscosity near the cell plasma membrane: measurement by evanescent field frequency-domain microfluorimetry. Biophys J. 1993;165:1272–1282. - PMC - PubMed
    1. Cole NB, Smith CL, Sciaky N, Terasaki M, Edidin M, Lippincott-Schwartz J. Diffusional mobility of Golgi proteins in membranes of living cells. Science. 1996;273:797–801. - PubMed
    1. DeGiorgi F, Brini M, Bastianutto C, Marsault R, Montero M, Pizzo P, Rozzi R, Rizzuto R. Targeting aequorin and green fluorescent protein to intracellular organelles. Gene. 1996;173:113–117. - PubMed
    1. Dix JA, Verkman AS. Mapping of fluorescence anisotropy in living cells by ratio imaging: application to cytoplasmic viscosity. Biophys J. 1990;57:231–240. - PMC - PubMed

Publication types

MeSH terms

Substances