. 1998 Feb;180(4):793-800.
doi: 10.1128/JB.180.4.793-800.1998.

Expression of invasin and motility are coordinately regulated in Yersinia enterocolitica

Affiliations

Expression of invasin and motility are coordinately regulated in Yersinia enterocolitica

J L Badger et al. J Bacteriol. 1998 Feb.

Abstract

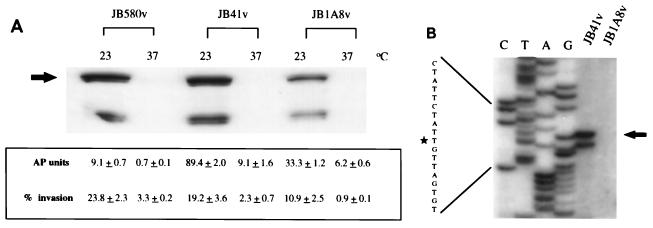
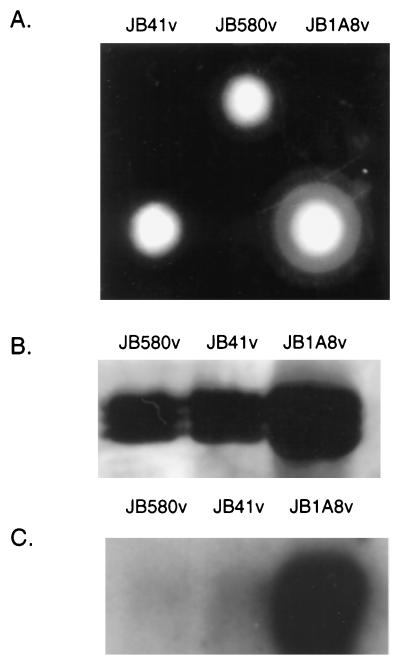
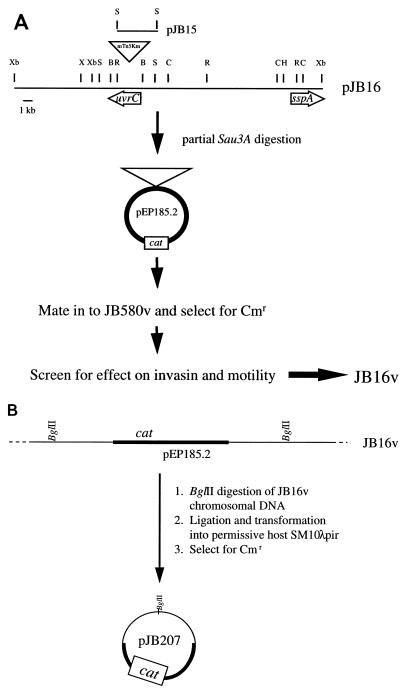
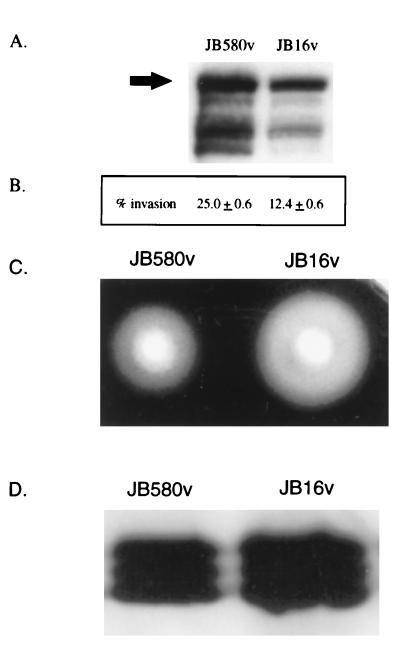
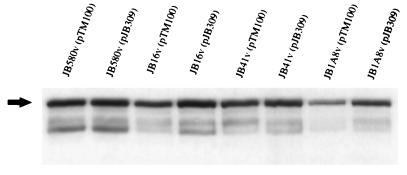
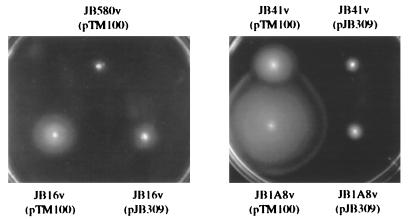
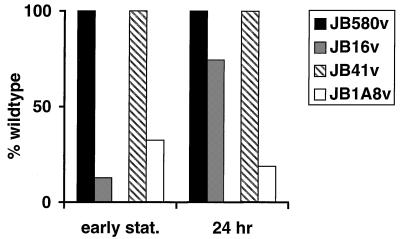
The Yersinia enterocolitica inv gene encodes the primary invasion factor invasin, which has been previously shown to be critical in the initial stages of infection. The expression of inv is influenced by growth phase and temperature and is maximal during late exponential-early stationary phase at 23 degrees C. In addition, motility of Y. enterocolitica is regulated by temperature. Y. enterocolitica cells are motile when grown at lower temperatures (30 degrees C or below), while bacteria grown at 37 degrees C are nonmotile. This study was initiated to determine the molecular basis for the temperature regulation of inv expression. Two mutants were isolated that both showed a significant decrease in invasin expression but are hypermotile when grown at 23 degrees C. The first mutant (JB1A8v) was a result of a random mTn5Km insertion into the uvrC gene. The uvrC mutant JB1A8v demonstrated a significant decrease in inv and an increase in fleB (encodes flagellin) expression. These results suggest that expression of inv and flagellin genes is coordinated at the level of transcription. The second regulatory mutant, JB16v, was a result of a targeted insertion into a locus similar to sspA which in E. coli encodes a stationary-phase regulator. The E. coli sspA gene was cloned and assayed for complementation in both of the regulatory mutants. It was determined that E. coli sspA restored invasin expression in both the uvrC mutant and the sspA mutant. In addition, the complementing clone decreased flagellin levels in these mutants.


Figures

FIG. 1
FIG. 1
Analysis of invasin expression in regulatory mutant JB1A8v. (A) Analysis of invasin protein levels and activity. Whole-cell extracts of the indicated strains grown at the indicated temperatures were separated by SDS-PAGE, and invasin was detected by Western analysis. The arrow points to the band representing full-length invasin. AP activities were assayed in duplicate and are represented as means and ranges. Invasion assays with HEp-2 cells were performed in duplicate, and the data are presented as means and ranges. (B) Comparison of inv mRNA levels in Y. enterocolitica JB41v and JB1A8v. Reverse transcriptase and labeled primer INV1 were used to primer extend total cellular RNAs from JB41v and JB1A8v grown at 23°C to late-log phase. The arrow points to the product of the primer extension reactions and corresponds to nucleotide −103 (star) with respect to the inv open reading frame. The data shown are from a single experiment and are representative of numerous experiments performed with similar results.
FIG. 2
FIG. 2
Motility phenotypes of JB1A8v. (A) Motility assays were performed with JB580v, JB41v, and JB1A8v in 0.3% soft agar plates incubated at 23°C for 16 h. (B) Western analysis of flagellin preparations probed with monoclonal antibody 15D8 as described in Materials and Methods. (C) Northern analysis of total cellular RNA isolated from mid-log-phase cultures probed with fleB-specific DNA. The data shown are from a single experiment and are representative of numerous experiments performed with similar results.
FIG. 3
FIG. 3
pJB16 physical map and schematic diagrams for construction of JB16v and cloning of pJB207. (A) Physical map of pJB16 and schematic diagram for construction of regulatory mutant JB16v. (B) Schematic diagram for cloning of pJB207. Restriction endonuclease sites indicated are not inclusive or unique. B, BamHI; C, ClaI; H, HindIII; R, EcoRI; S, SacI; Xb, XbaI; X, XhoI.
FIG. 4
FIG. 4
Phenotype of reconstructed mutant JB16v. (A) Invasin expression in regenerated regulatory mutant JB16v. Whole-cell extracts of JB580v and JB16v grown at 23°C were separated by SDS-PAGE, and invasin levels were determined by Western analysis. The arrow points to the band representing full-length invasin. (B) Invasion phenotype exhibited by JB580v and JB16v. Invasion assays with HEp-2 cells were performed in duplicate, and the data presented are means and ranges. (C) Motility phenotype of regenerated regulatory mutant JB16v. Motility assays were performed with JB580v and JB16v in 0.3% soft agar plates incubated at 23°C for 16 h. (D) Western analysis of flagellin preparations probed with monoclonal antibody 15D8 as described in Materials and Methods. The data shown are from a single experiment and are representative of numerous experiments performed with similar results.
FIG. 5
FIG. 5
Complementation of JB1A8v and JB16v invasin levels with pJB309. Western analysis of invasin expression by JB580v, JB16v, JB41v, and JB1A8v harboring either pTM100 (cloning vector) or pJB309 (E. coli sspA). Whole-cell extracts of the indicated strains grown at 23°C were separated by SDS-PAGE, and invasin levels were determined by Western analysis. The arrow points to the band representing full-length invasin. The data shown are from a single experiment and are representative of numerous experiments performed with similar results.
FIG. 6
FIG. 6
Complementation of JB1A8v and JB16v motility phenotype with pJB309. Motility assays were performed with the strains indicated and 0.3% soft agar plates incubated at 23°C for 16 h. The data shown are from a single experiment and are representative of numerous experiments performed with similar results.
FIG. 7
FIG. 7
Effect of growth phase on mutants JB16v and JB1A8v. Cultures grown for 16 h at 23°C were diluted to an OD600 of 0.1 and grown at 23°C in LB, and aliquots were taken at the indicated growth phase points. Invasin levels detected by immunoblot analysis were estimated by densitometry. The data shown are from a single experiment and are representative of numerous experiments performed with similar results. stat., stationary phase.

References

    1. Badger, J. L., and V. L. Miller. The co-ordinate regulation of invasin and motility in Yersinia enterocolitica is dependent on ClpB and the alternative sigma factor FliA. Submitted for publication.
    1. Badger J L, Miller V L. Role of RpoS in survival of Yersinia enterocolitica to a variety of environmental stresses. J Bacteriol. 1995;177:5370–5373. - PMC - PubMed
    1. Badger, J. L., and V. L. Miller. Unpublished results.
    1. Bajaj V, Lucas R L, Hwang C, Lee C A. Co-ordinate regulation of Salmonella typhimurium invasion genes by environmental and regulatory factors is mediated by control of hilA expression. Mol Microbiol. 1996;22:703–714. - PubMed
    1. Bliska J, Falkow S. Bacterial resistance to complement killing mediated by the Ail protein of Yersinia enterocolitica. Proc Natl Acad Sci USA. 1992;89:3561–3565. - PMC - PubMed

Publication types

MeSH terms

LinkOut - more resources