. 1998 Mar 2;187(5):703-9.
doi: 10.1084/jem.187.5.703.

Regulation of B lymphocyte development by the truncated immunoglobulin heavy chain protein Dmu

Affiliations

Regulation of B lymphocyte development by the truncated immunoglobulin heavy chain protein Dmu

U C Tornberg et al. J Exp Med. .

Abstract

The development of B lymphocytes from progenitor cells is dependent on the expression of a pre-B cell-specific receptor made up by a mu heavy chain associated with the surrogate light chains, immunoglobulin (Ig)alpha, and Igbeta. A variant pre-B cell receptor can be formed in which the mu heavy chain is exchanged for a truncated mu chain denoted Dmu. To investigate the role of this receptor in the development of B cells, we have generated transgenic mice that express the Dmu protein in cells of the B lineage. Analysis of these mice reveal that Dmu expression leads to a partial block in B cell development at the early pre-B cell stage, probably by inhibiting VH to DHJH rearrangement. Furthermore, we provide evidence that Dmu induces VL to JL rearrangements.


Figures

Figure 1
Figure 1
(A) Schematic outline of the transgenic constructs used. The Dμ-endo construct included a 0.3-kb fragment containing the endogenous promoter (open box), a DFLJH4 rearrangement in RF2, the IgH enhancer (E), and the complete Cμ sequence. Arrowheads, the location of PCR primers used to generate the constructs. The probe used for Southern blot analysis is depicted in the figure together with the size of the BamHI fragment detected in transgenic mice (6.5 kb). The construct used to create Dμ– mb-1 transgenic mice was derived from the Dμ-endo construct by replacing the region upstream of the ATG with a 0.3-kb fragment containing the mb-1 promoter (shaded box). B, BamHI; N, NotI; R, EcoRI; Xb, XbaI; Xh, XhoI. (B) Southern blot analysis of genomic tail DNA digested with BamHI and hybridized with Cμ exon 1 as a probe. The 6.5-kb Dμ transgenic band and the ∼10-kb band representing the endogenous Cμ locus are indicated. Lane 1, C57/BL6; lane 2, Dμ-endo, founder 13; lane 3, Dμ–mb-1, founder 23. The transgenic band in lane 3 is 0.3 kb shorter than in lane 2, due to the insertion of a BamHI site 3′of the mb1 promoter in the construct. (C) Northern blot analysis of total RNA from bone marrow and spleen cells hybridized with a probe complementary to the DHJH joint used in the constructs. Blots from transgenic (tg) mice and littermate controls (lm) are shown. Lanes 1, 2, 5, and 6: Dμ–mb-1 line 26. Lanes 3, 4, 7, and 8: Dμ-endo line 11. The 1.9-kb Dμ transcript and the 18 S ribosomal RNA are indicated in the figure. GAPDH was used as a control for quantification. (D) Expression of the Dμ protein in transgenic mice. Proteins extracted from bone marrow or spleen cells were analyzed by Western blot. A band of ∼69 kD was detected in transgenic mice using an anti-IgM antibody. Blots representing transgenic (tg) mice and littermate controls (lm) are shown. Dμ–mb-1, lanes 1, 2, 5, and 6; Dμ-endo, lanes 3, 4, 7, and 8. (E ) VHDHJH and DHJH rearrangements in Dμ-endo transgenic mice. B220+CD43+ pre–B cells were isolated by cell sorting from transgenic mice (tg) and from littermate controls (lm). Semiquantitative PCR (28) was performed using a primer hybridizing to a sequence downstream of JH2, together with primers complementary to either recombination sequences 5′of all D regions or to members of the J558 family. As the target sequence for the JH primer is not included in the transgenic construct, there is no amplification of the transgene itself. Limited PCR amplification of a nonrearranging locus (λ5) was used to normalize the DNA content in the reactions. PCR products were hybridized with a probe complementary to the JH1 and JH2 exons, or to the λ5 gene. The upper and lower panels show rearrangements to the JH1 and the JH2 gene segments, respectively.
Figure 2
Figure 2
Flow cytometric analysis of newborn liver and bone marrow cells from Dμ-endo transgenic mice, Dμ-mb-1 transgenic mice, and littermate controls. Cells were stained with anti-B220-PE and anti-IgM-FITC and analyzed on FACScan®. The lymphocyte population was gated according to standard forward- and side-scatter values. The numbers above the framed areas represent the percentage of B220+IgM and B220+IgM+ cells out of the total number of gated lymphocytes.
Figure 3
Figure 3
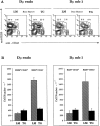
Flow cytometric analysis of bone marrow cells from 3-wk-old Dμ-endo transgenic mice, Dμ–mb-1 transgenic mice, and littermate controls. (A) FACS® profiles of cells stained with anti-CD43 and anti-B220 and analyzed on FACScan®. The lymphocyte population was gated according to standard forward- and side-scatter values. The numbers above the framed areas represent the percentage of B220+CD43 and B220+CD43+ cells out of the total number of gated lymphocytes. (B) Numbers of B220+CD43 and B220+CD43+ cells per femur displayed as histogram plots.
Figure 4
Figure 4
Flow cytometric analysis of bone marrow cells from 3-wk-old Dμ-endo transgenic mice, Dμ–mb-1 transgenic mice, and littermate controls. (A) FACS® profiles of cells stained with anti-CD43, anti-BP-1, and anti-HSA, and analyzed on FACScan®. The lymphocyte population was gated according to standard forward and side-scatter values. Cells expressing BP-1 and intermediate levels of CD43 (indicated as a framed population) were analyzed for HSA expression and are displayed as a separate histogram. (B) Numbers of CD43+, BP-1+, HSAhigh and CD43+, BP-1+, HSAlow cells per femur are displayed as histogram plots.
Figure 5
Figure 5
Northern blot analysis of total RNA from bone marrow and spleen cells hybridized with a probe complementary to the Cκ. Blots from transgenic (tg) mice and wild-type littermates (lm) are shown. Lanes 1, 2, 5, and 6: Dμ-mb-1 line 26. Lanes 3, 4, 7, and 8: Dμ-endo line 11. The κ transcript is indicated in the figure. mb-1 was used as a control for quantification.

Similar articles

Cited by

References

    1. Tonegawa S. Somatic generation of antibody diversity. Nature. 1983;302:575–581. - PubMed
    1. Alt FW, Yancopoulos GD, Blackwell TK, Wood C, Thomas E, Boss M, Coffman R, Rosenberg N, Tonegawa S, Baltimore D. Ordered rearrangement of immunoglobulin heavy chain variable region segments. EMBO (Eur MOL Biol Organ) J. 1984;3:1209–1219. - PMC - PubMed
    1. Pillai S, Baltimore D. Formation of disulphide-linked μ2 ω2 tetramers in pre–B cells by the 18K ω-immunoglobulin light chain. Nature. 1987;329:172–174. - PubMed
    1. Karasuyama H, Kudo A, Melchers F. The proteins encoded by the VpreB and λ5pre–B cell-specific genes can associate with each other and with μ heavy chain. J Exp Med. 1990;172:969–972. - PMC - PubMed
    1. Sakaguchi N, Melchers F. λ5, a new light-chain– related locus selectively expressed in pre–B lymphocytes. Nature. 1986;324:579–582. - PubMed

Publication types

Substances