. 1998 Mar 2;187(5):787-94.
doi: 10.1084/jem.187.5.787.

Selective expression of a stable cell surface molecule on type 2 but not type 1 helper T cells

Affiliations

Selective expression of a stable cell surface molecule on type 2 but not type 1 helper T cells

D Xu et al. J Exp Med. .

Abstract

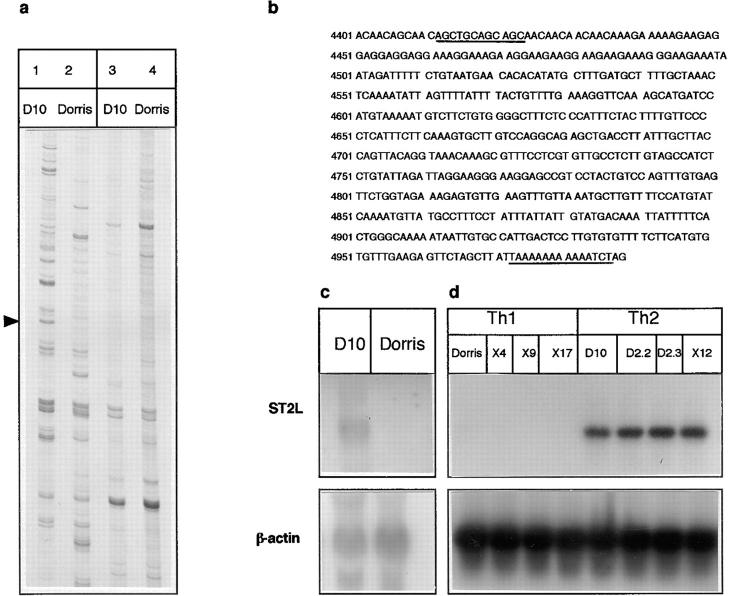
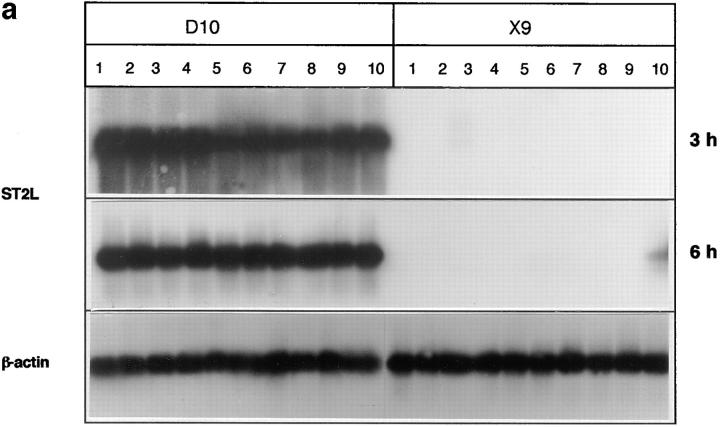
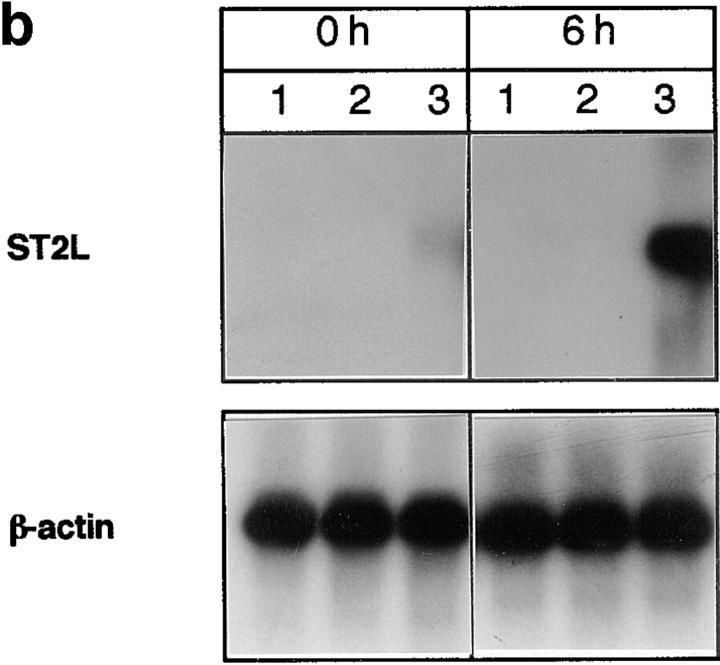
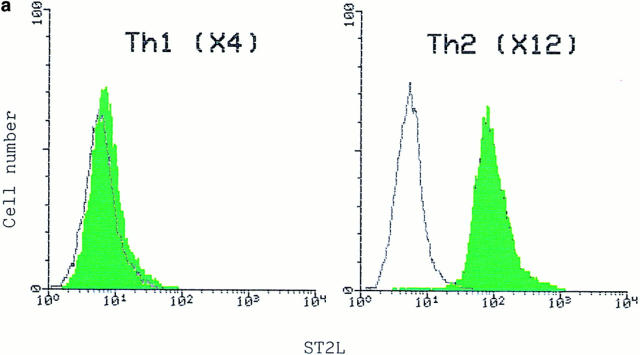
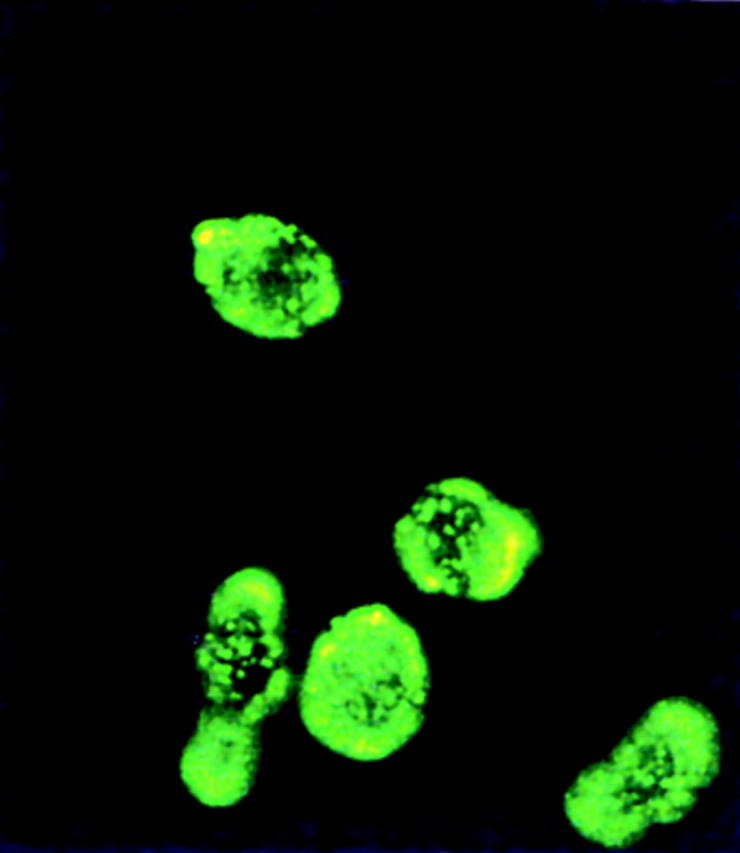
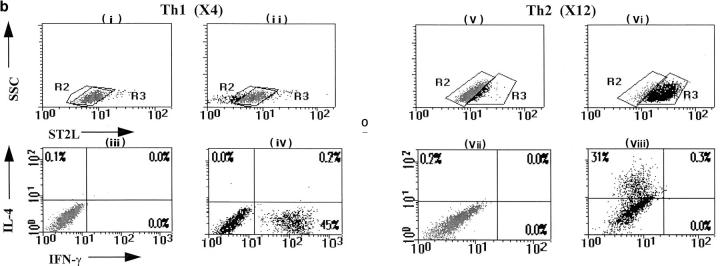
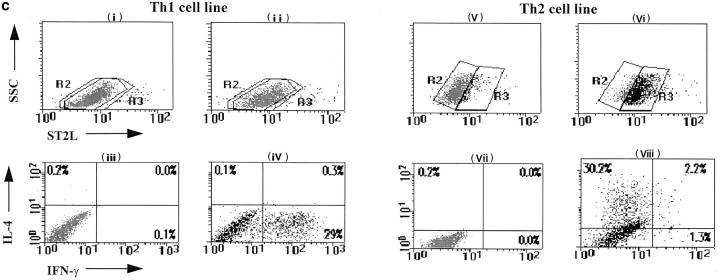
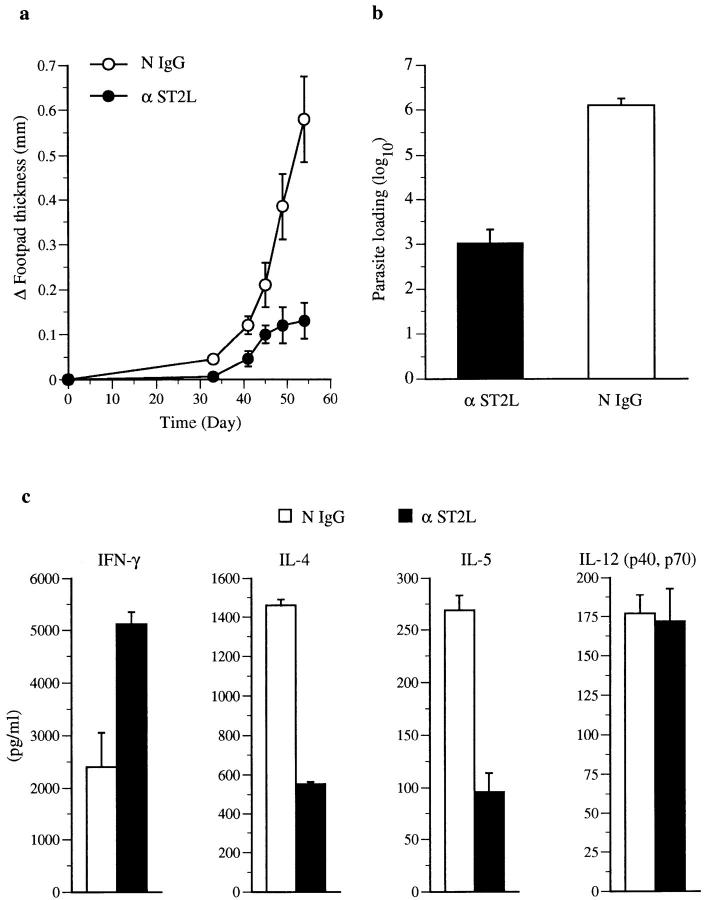
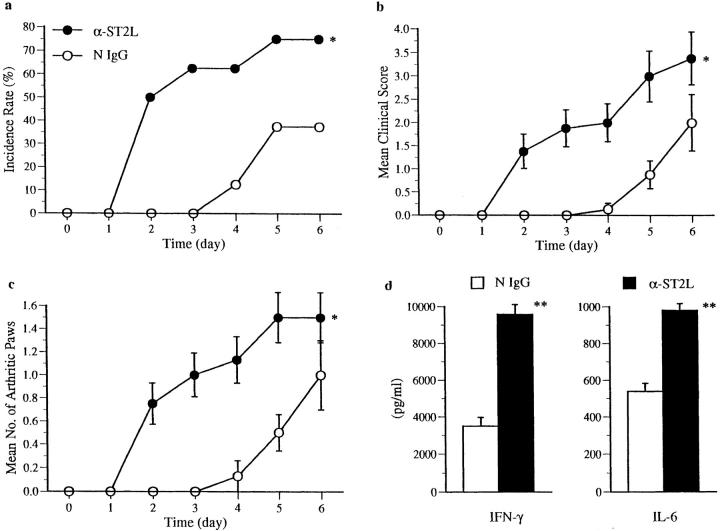
T helper cell type 1 (Th1) and 2 (Th2) are central to immune regulation. However, no stable cell surface marker capable of distinguishing and separating these two subsets of CD4(+) cells has yet been found. Using differential display PCR, we have identified a gene encoding a cell membrane bound molecule, originally designated ST2L, T1, DER4, or Fit, expressed constitutively and stably on the surface of murine Th2s, but not Th1s even after stimulation with a range of immunological stimuli. Antibody against a peptide derived from ST2L strongly and stably labeled the surface of cloned Th2s but not Th1s, and Th2s but not Th1s derived from naive T cells of ovalbumin T cell receptor-alpha/beta transgenic mice. Three-color single cell flow cytometric analysis shows that cell surface ST2L coexpressed with intracellular interleukin (IL)-4, but not with interferon (IFN)-gamma. The antibody selectively lysed Th2s in vitro in a complement-dependent manner. In vivo, it enhanced Th1 responses by increasing IFN-gamma production and decreasing IL-4 and IL-5 synthesis. It induced resistance to Leishmania major infection in BALB/c mice and exacerbated collagen-induced arthritis in DBA/1 mice. Thus, ST2L is a stable marker distinguishing Th2s from Th1s and is also associated with Th2 functions. Hence, it may be a target for therapeutic intervention.


Figures

Figure 1
Figure 1
Detection of ST2L message in Th2s. RNA from a panel of four each of different Th1 (Dorris, X4, X9, and X17) and Th2 (D10, D2.2, D2.3, and X12) clones (resting cells, two wk after antigen stimulation) were extracted and compared by DD-PCR. (a) Two representative patterns comparing the PCR products from Dorris (Th1) and D10 (Th2) cells, using two different primer pairs (lanes 1 and 2, H-T11A/H-AP34; lanes 3 and 4, H-T11G/H-AP34). Arrowhead, the ST2L band. (b) Nucleotide sequence of one cDNA present in Th2s, but not in Th1s. This has complete homology with the 3′ terminus of ST2L cDNA. (Data are available from EMBL/GenBank/DDBJ under accession number D13695.) The primer (H-T11A/H-AP34) binding sites are underlined. (c) Northern blot analysis detected ST2L in D10, but not in Dorris cells. Similar results were obtained for the other three Th1 and Th2 clones (not shown). (d) Reverse transcriptase PCR Southern demonstrates the presence of ST2L message in Th2, but not in Th1, clones. c and d are representative of three experiments.
Figure 2
Figure 2
(a) Regulation of ST2L gene expression in vitro analyzed by reverse transcriptase PCR Southern. Representative Th1 (X9) and Th2 (D10) clones were stimulated for 3, 6, or 12 h with: lane 1, Con A (2.5 μg/ml); lane 2, IL-1β; lane 3, IL-5; lane 4, IL-2; lane 5, IL-4; lane 6, IFN-γ (all cytokines were recombinant murine proteins obtained from Genzyme [Cambridge, MA] used at 5 ng/ml); lane 7, anti–IFN-γ (1 μg/ml); lane 8, anti–IL-4 (1 μg/ml); lane 9, medium alone; lane 10, anti-CD3 (1.5 μg/ml). Results for 12 h (not shown) were the same as for 3 h, except no message was detected in X9. D10 cells expressed ST2L constitutively and stably, whereas X9 cells failed to do so, except a weak and transient response at 3 and 6 h to IL-5 and anti-CD3, respectively. (b) Regulation of ST2L expression in T cells by serum. X9 (Th1, lane 1), X4 (Th1, lane 2), and D10 (Th2, lane 3) were cultured for 48 h in medium without serum or IL-2, and then incubated with medium containing 20% FCS. Cells were harvested at that time (0 h) or 6 h after addition of FCS, and ST2L message was analyzed by reverse transcriptase PCR Southern blot. Serum failed to induce ST2L in Th1s. Results are representative of four Th1 and Th2 clones.
Figure 2
Figure 2
(a) Regulation of ST2L gene expression in vitro analyzed by reverse transcriptase PCR Southern. Representative Th1 (X9) and Th2 (D10) clones were stimulated for 3, 6, or 12 h with: lane 1, Con A (2.5 μg/ml); lane 2, IL-1β; lane 3, IL-5; lane 4, IL-2; lane 5, IL-4; lane 6, IFN-γ (all cytokines were recombinant murine proteins obtained from Genzyme [Cambridge, MA] used at 5 ng/ml); lane 7, anti–IFN-γ (1 μg/ml); lane 8, anti–IL-4 (1 μg/ml); lane 9, medium alone; lane 10, anti-CD3 (1.5 μg/ml). Results for 12 h (not shown) were the same as for 3 h, except no message was detected in X9. D10 cells expressed ST2L constitutively and stably, whereas X9 cells failed to do so, except a weak and transient response at 3 and 6 h to IL-5 and anti-CD3, respectively. (b) Regulation of ST2L expression in T cells by serum. X9 (Th1, lane 1), X4 (Th1, lane 2), and D10 (Th2, lane 3) were cultured for 48 h in medium without serum or IL-2, and then incubated with medium containing 20% FCS. Cells were harvested at that time (0 h) or 6 h after addition of FCS, and ST2L message was analyzed by reverse transcriptase PCR Southern blot. Serum failed to induce ST2L in Th1s. Results are representative of four Th1 and Th2 clones.
Figure 3
Figure 3
FACS® analysis of cell surface expression of ST2L. (a) Th1 (X4) and Th2 (X12) cells were stained with rabbit anti-ST2L antibody (green) or preimmune rabbit IgG (white) (40 μg/ml) and developed with an FITC-conjugated donkey anti–rabbit IgG. Similar results were obtained for three other Th1 and Th2 clones (not shown). The staining of Th2s (X12) with anti-ST2L antibody can also be visualized by fluorescent microscopy (×400). Staining can be blocked by the ST2L peptide (100 μg/ml) and no staining was detected on Th1s (data not shown). (b) Three-color flow cytometric analysis of Th1 (X4) and Th2 (X12) clones. Th2 (X12) and Th1 (X4) clones were stained for cell surface ST2L (with PerCP), followed by intracellular staining with anti–IL-4 (with PE) and anti–IFN-γ (with FITC). All cells shown in the boxes were activated with PMA/ionomycin. Cells analyzed in boxes (i), (iii), (v) and (vii) were stained with normal rabbit IgG and isotype controls for anti–IFN-γ and anti–IL-4, whereas cells in boxes (ii), (iv), (vi), and (viii) were stained with rabbit anti-ST2L, anti–IFN-γ, and anti–IL-4 antibodies. Cells in boxes (i), (ii), (v), and (vi) have been gated for positive expression of ST2L when stained with anti-ST2L antibody (R3, black) relative to negative staining with control rabbit IgG (R2, gray). Colocalization of R2 and R3 depicts negative expression of ST2L. Cytokines in the culture supernatants (48 h) of T cell clones (106/ml) stimulated with specific antigen and irradiated antigen-presenting cells were (IFN-γ versus IL-4, ng/ml): X4, 5.2 versus <0.02; X12, <0.01 versus 0.25. (c) Three-color flow cytometric analysis of Th1s and Th2s derived from naive T cells. CD4+ splenic T cells from D011.10 TCR-α/β transgenic mice were driven to Th1 or Th2 subsets in a 6-d culture. They were then stimulated with PMA/ionomycin, stained, and analyzed as in b. Cytokines in the culture supernatants (day 3) were (IFN-γ versus IL-5, ng/ml): Th1 line, 2.6 versus <0.02; Th2 line, <0.01 versus 0.52. Results are representative of five experiments.
Figure 3
Figure 3
FACS® analysis of cell surface expression of ST2L. (a) Th1 (X4) and Th2 (X12) cells were stained with rabbit anti-ST2L antibody (green) or preimmune rabbit IgG (white) (40 μg/ml) and developed with an FITC-conjugated donkey anti–rabbit IgG. Similar results were obtained for three other Th1 and Th2 clones (not shown). The staining of Th2s (X12) with anti-ST2L antibody can also be visualized by fluorescent microscopy (×400). Staining can be blocked by the ST2L peptide (100 μg/ml) and no staining was detected on Th1s (data not shown). (b) Three-color flow cytometric analysis of Th1 (X4) and Th2 (X12) clones. Th2 (X12) and Th1 (X4) clones were stained for cell surface ST2L (with PerCP), followed by intracellular staining with anti–IL-4 (with PE) and anti–IFN-γ (with FITC). All cells shown in the boxes were activated with PMA/ionomycin. Cells analyzed in boxes (i), (iii), (v) and (vii) were stained with normal rabbit IgG and isotype controls for anti–IFN-γ and anti–IL-4, whereas cells in boxes (ii), (iv), (vi), and (viii) were stained with rabbit anti-ST2L, anti–IFN-γ, and anti–IL-4 antibodies. Cells in boxes (i), (ii), (v), and (vi) have been gated for positive expression of ST2L when stained with anti-ST2L antibody (R3, black) relative to negative staining with control rabbit IgG (R2, gray). Colocalization of R2 and R3 depicts negative expression of ST2L. Cytokines in the culture supernatants (48 h) of T cell clones (106/ml) stimulated with specific antigen and irradiated antigen-presenting cells were (IFN-γ versus IL-4, ng/ml): X4, 5.2 versus <0.02; X12, <0.01 versus 0.25. (c) Three-color flow cytometric analysis of Th1s and Th2s derived from naive T cells. CD4+ splenic T cells from D011.10 TCR-α/β transgenic mice were driven to Th1 or Th2 subsets in a 6-d culture. They were then stimulated with PMA/ionomycin, stained, and analyzed as in b. Cytokines in the culture supernatants (day 3) were (IFN-γ versus IL-5, ng/ml): Th1 line, 2.6 versus <0.02; Th2 line, <0.01 versus 0.52. Results are representative of five experiments.
Figure 4
Figure 4
Effect of anti-ST2L antibody on L. major infection. BALB/c mice were infected in the footpad with the parasite and injected intraperitoneally with anti-ST2L antibody or normal rabbit IgG. Antibody-treated mice developed significantly smaller lesions (a) and parasite loads (b) compared with controls, n = 10. Experiments were terminated when control mice developed necrotic lesions as required by the United Kingdom Home Office guidelines. (c) Draining lymph node cells were pooled (n = 10) and cultured with leishmanial antigen, and supernatants from triplicate cultures assayed for cytokines. There was no significant difference in the T cell proliferative response between the two groups of mice (data not shown). Results are representative of two experiments.
Figure 5
Figure 5
Anti-ST2L antibody exacerbated collagen-induced arthritis in DBA/1 mice. Mice were primed (day −21) and challenged (day 0) with collagen and injected with anti-ST2L antibody or normal rabbit IgG daily from day 1. (a) Incidence rate (percent), (b) clinical score, and (c) number of arthritic paws. Data are mean ± SEM, n = 15. Mice (n = 4) were killed 48 h after antibody treatment, spleen cells were pooled and cultured with collagen (50 μg/ml) for 48– 96 h, and culture supernatants were assayed for cytokines by ELISA. *P <0.05, **P <0.01 (two sample t test). IL-4 and IL-5 were not detected (<20 pg/ml). T cell proliferation was expressed as [3H]thymidine uptake in triplicate cultures (mean cpm × 103 ± SEM): antibody treated, 52.8 ± 6.8; control, 27.8 ± 1.1 (P <0.05).

References

    1. Sher A, Coffman RL. Regulation of immunity to parasites by T cells and T cell–derived cytokines. Annu Rev Immunol. 1992;10:385–409. - PubMed
    1. Abbas AK, Murphy KM, Sher A. Functional diversity of helper T lymphocytes. Nature. 1996;383:787–793. - PubMed
    1. Mosmann TR, Coffman RL. Th1 and Th2 cells: different patterns of lymphokine secretion lead to different functional properties. Annu Rev Immunol. 1989;7:145–173. - PubMed
    1. Delprete G, Defcarli M, Almerigogna F, Daniel CK, Delios MM, Zancuoghi G, Vinante F, Pizzolo G, Romagnani S. Preferential expression of CD30 by human CD4+ T cells producing Th2-type cytokines. FASEB J. 1995;9:81–86. - PubMed
    1. Szabo SJ, Dighe AS, Gubler U, Murphy KM. Regulation of the interleukin (IL)-12R β2 subunit expression in developing T helper 1 (Th1) and Th2 cells. J Exp Med. 1997;185:817–824. - PMC - PubMed

Publication types

Substances