. 1998 Jan 1;506 ( Pt 1)(Pt 1):109-25.
doi: 10.1111/j.1469-7793.1998.109bx.x.

Submaximal stimulation of porcine endothelial cells causes focal Ca2+ elevation beneath the cell membrane

Affiliations

Submaximal stimulation of porcine endothelial cells causes focal Ca2+ elevation beneath the cell membrane

W F Graier et al. J Physiol. .

Abstract

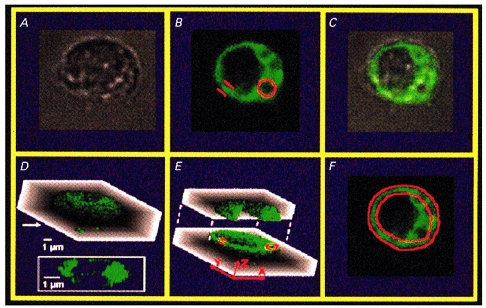
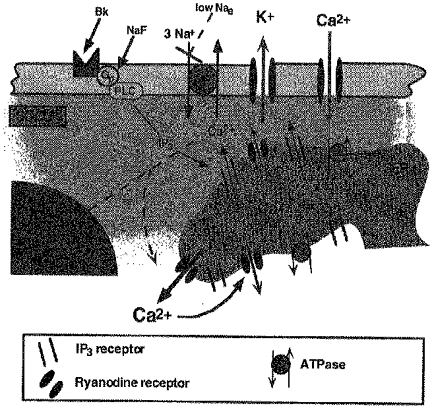
1. Endothelial cell activation is correlated with increased cytosolic Ca2+ concentration, often monitored with cytoplasmic Ca2+ dyes, such as fura-2 and Calcium Green-1. We tested the hypothesis that during weak stimulation of porcine coronary artery endothelial cells, focal, subplasmalemmal Ca2+ elevations occur which are controlled by cell membrane Na(+)-Ca2+ exchange near mitochondrial membrane and superficial endoplasmic reticulum (SER). 2. Bulk Ca2+ concentration ([Ca2+]b) was monitored using fura-2 or Calcium Green-1 and subplasmalemmal Ca2+ concentration ([Ca2+]sp) was determined with FFP-18. The distribution of the SER network was estimated using laser scanning and deconvolution microscopy. 3. Sodium fluoride (10 mmol l-1) and submaximal concentrations of bradykinin (Bk; 1 nmol l-1) stimulated Ca2+ entry with no increase in [Ca2+]b. Although inositol 1,4,5-trisphosphate formation and intracellular Ca2+ release in response to both stimuli were similar, Ca2+ entry in response to NaF exceeded that in response to 1 nmol l-1 BK by fourfold, suggesting additional effects of NaF on Ca+ entry pathways but stimulation via intracellular Ca2+ release. 4. Prevention of Na(+)-Ca2+ exchange activity by decreasing extracellular Na+ unmasked intracellular Ca2+ release in response to NaF and 1 nmol l-1 Bk, indicated by an increase in [Ca2+]b. Thereby, NaF depleted Bk-releasable Ca2+ pools, while mitochondrial Ca2+ content (released with FCCP or oligomycin) and the amount of Ca2+ stored within the cells (released with ionomycin) was increased compared with cells treated with NaF under normal Na+ conditions. The NaF-initiated increase in [Ca2+]b and depletion of Bk-releasable Ca2+ pool(s) in the low-Na+ condition was diminished by 25 mumol l-1 ryanodine, indicating the involvement of Ca(2+)-induced Ca2+ release (CICR). 5. In simultaneous recordings of [Ca2+]sp (with FFP-18) and [Ca2+]b (with Calcium Green-1), 1 nmol l-1 Bk or 10 mmol l-1 NaF yielded focal [Ca2+] elevation in the subplasmalemmal region with no increase in the perinuclear area. 6. Treatment with 10 mumol-1 nocodazole caused the SER to collapse and unmasked Ca2+ release in response to 1 nmol l-1 Bk and 10 mmol l-1 NaF, similar to low-Na+ conditions, while the effect of thapsigargin was not changed. 7. These data show that in endothelial cells, focal, subplasmalemmal Ca2+ elevations in response to small or slow IP3 formation occur due to vectorial Ca2+ release from the SER towards the plasmalemma followed by Ca2+ extrusion by Na(+)-Ca2+ exchange. While these local Ca2+ elevations are not detectable with Ca2+ dyes for the determination of [Ca2+]b, prevention of Ca2+ extrusion or SER disruption yields increases in [Ca2+]b partially due to CICR. 8. All of the data support our hypothesis that in weakly stimulated endothelial cells, intracellular Ca2+ release and [Ca2+] elevation are limited to the subplasmalemmal region. We propose that the SER co-operates with associated parts of the plasma membrane to control Ca2+ homeostasis, Ca2+ distribution and Ca2+ entry. The existence of such a subplasmalemmal Ca2+ control unit (SCCU) needs to be considered in discussions of Ca2+ signalling, especially when cytoplasmic Ca2+ dyes, such as fura-2 or Calcium Green-1, are used.


Figures

Figure 1
Figure 1. Effect of bradykinin and NaF on cultured porcine endothelial inositol 1,4,5-trisphosphate (IP3) levels
A, comparison of the time course of IP3 formation in response to NaF and bradykinin. Endothelial cells were preincubated with myo-[3H]inositol for 48 h in DMEM. In the nominal absence of extracellular Ca2+, cells were stimulated with either 100 nmol l−1 bradykinin (^) or 10 mmol l−1 NaF (•) and experiments were stopped at times indicated. Levels of endothelial IP3 were expressed as percentage increases of the IP3 levels in cells under resting conditions. B, comparison of the IP3 formation within 30 s to 1, 10, 30, 100 and 1000 nmol l−1 bradykinin (•) and 10 mmol l−1 NaF (column) measured by radioactive binding assay. Each point represents the mean ±s.e.m. (n = 4-6).
Figure 2
Figure 2. Representative tracings of the intracellular Ca2+ signalling in cultured endothelial cells in monolayer stimulated with bradykinin (A) and NaF (B)
Agonists were added in nominal Ca2+-free solution followed by the addition of 2.5 mmol l−1 Ca2+, indicated by the bars. A, endothelial Ca2+ response to 100 nmol l−1 bradykinin was monitored with Calcium Green-1, and increased bulk Ca2+ ([Ca2+]b) is demonstrated by changes in the fluorescence intensity (F.I.) of the Ca2+-sensitive wavelength of Calcium Green-1 measured at 506 nm excitation and 534 nm emission. B, effect of 10 mmol l−1 NaF on intracellular Ca2+ in fura-2-loaded cells in the nominal absence of extracellular Ca2+ followed by an addition of 2.5 mmol l−1 Ca2+ (^, continuous line). Addition of 2.5 mmol l−1 Ca2+ without pre-stimulation with NaF is shown also (•). Points represent means ±s.e.m. (n = 24).
Figure 3
Figure 3. Lowering extracellular sodium concentration unmasked NaF- (A and B) and bradykinin-induced (C) intracellular Ca2+ release
Single endothelial cells loaded with fura-2 were stimulated with 10 mmol l−1 NaF (A) at various concentrations of bradykinin (C) in the nominal absence of extracellular Ca2+ in buffer containing 145 mmol l−1 (normal Na+, ^, continuous line) or 19 mmol l−1 extracellular Na+ (low Na+, □, dashed line). In experiments where 19 mmol l−1 extracellular Na+ buffer was used, extracellular Na+ was changed to 145 mmol l−1 at time 6 min. Each point represents the mean ±s.e.m. (n = 19 in A and n = 8 in C). B, correlation of the extracellular Na+ concentration used in the experiments with the NaF-induced (10 mmol l−1) increases in intracellular free Ca2+ monitored by fura-2 in the nominal absence of extracellular Ca2+. Each point represents the mean ±s.e.m. (n = 6-19).
Figure 4
Figure 4. Effect of NaF in depleting the bradykinin-sensitive Ca2+ pool in normal and low-sodium buffer (A) and in the absence and presence of ryanodine (B)
A, single endothelial cells were loaded with fura-2 and stimulated in the nominal absence of extracellular Ca2+ with 10 mmol l−1 NaF followed by 100 nmol l−1 bradykinin (Bk). Experiments were performed in solution containing 145 mmol l−1 Na+ (normal Na, ^, continuous line) and 19 mmol l−1 Na+ (low Na, □, dashed plot). In experiments in 19 mmol l−1 Na+ buffer, extracellular Na+ was changed to 145 mmol l−1 at time 6 min. Each point represents the mean ±s.e.m. (n = 16). B, cells were stimulated in 19 mmol l−1 Na+ buffer in nominal Ca2+-free solution for 2 min with 10 mmol l−1 NaF in the absence (Control, ^, dashed line) or presence of 25 μmol l−1 ryanodine (Ryanodine, •, continuous line). After 2.5 min extracellular Na+ was changed to 145 mmol l−1 and NaF and ryanodine were washed out, followed by the addition of 100 nmol l−1 Bk for 2 min. Each point represents the mean ±s.e.m. (n = 4).
Figure 5
Figure 5. Effect of NaF on overall Ca2+ stored within the cells (A) and on mitochondrial Ca2+ (B) in normal and low-sodium buffer
A, single endothelial cells were loaded with fura-2 and stimulated in the nominal absence of extracellular Ca2+ with 10 mmol l−1 NaF followed by 5 μmol l−1 ionomycin as bars indicate. Experiment was performed in solution containing 145 mmol l−1 extracellular Na+ (normal Na, ^, continuous line) and 19 mmol l−1 extracellular Na+ (low Na, □, dashed line). In experiments where 19 mmol l−1 extracellular Na+ buffer was used, extracellular Na+ was changed to 145 mmol l−1 at time 6 min. Each point represents the mean ±s.e.m. (n = 10-12). B, in cells pre-stimulated in the nominal absence of extracellular Ca2+ with 10 mmol l−1 NaF, mitochondrial Ca2+ was released using 10 μmol l−1 FCCP or 10 μmol l−1 oligomycin. Columns represent the means ±s.e.m. (n = 4-8). *P < 0.05 vs. experiments in the presence of 145 mmol l−1 extracellular Na+.
Figure 6
Figure 6. Representative tracings of the Ca2+ signalling in response to stimulation with 100 nmol l−1 bradykinin measured by fura-2 (A) and Calcium Green-1 (B) after laser-pulse wave loading procedure and the effect of sub-maximal concentration of bradykinin (1 nmol l−1) on suspended porcine endothelial Ca2+ concentration detected by FFP-18 (C and D) and Calcium Green-1 (D)
Cultured endothelial cells were harvested by enzymatic digestion, centrifuged and resuspended in DMEM containing 2 μmol l−1 fura-2 pentapotassium salt (A) or 5 μmol l−1 Calcium Green-1 hexapotassium salt (B). Dye loading was performed using laser pulse wave loading procedure (LSWP) as described in Methods. Experiments were performed in nominal Ca2+-free saline. As bars indicate, 100 nmol l−1 bradykinin and 2.5 mmol l−1 Ca2+ were added. C, effect of laser-pulse wave loading procedure for FFP-18 loading in endothelial cells. Endothelial cells were preincubated for 45 min with 2 μmol l−1 FFP-18 at room temperature in the dark (continuous line, ○) or were loaded using LSWP (dashed line, •). Experiments were performed in the nominal absence of extracellular Ca2+. At times indicated 1 nmol l−1 bradykinin or 2.5 mmol l−1 Ca2+ were added. Each point represents the mean ±s.e.m. (n = 5). D, simultaneous recordings of subplasmalemmal Ca2+ concentration detected by FFP-18 (dashed line, •) and mean cytoplasmic Ca2+ concentration measured with Calcium Green-1 (continuous line, ○). Each point represents the mean ±s.e.m. (n = 4).
Figure 7
Figure 7. Confocal image of ryanodine receptor distribution in living endothelial cells
Freshly isolated endothelial cells were loaded with 10−7 mol l−1 BODIPY FL-X ryanodine for 10 min and images were collected using a confocal microscope. The figure shows a transmitted light image (A), the corresponding confocal image at approximately the middle depth of the cell (B) and a composite image of A and B (C). D shows a 3-dimensional reconstruction of 13 optical sections taken at 1 μm steps in the z-axis and the inset presents the single section in the x-y plane taken at the arrow. E, a 3-dimensional reconstruction above the x-y plane shown in B. The red circles and lines indicate corresponding areas in B and E. In F the plasmalemma is indicated by the outer red circle defined by the transmitted light image given in A and C. The inner red circle shows an erosion of 3 pixels from the plasmalemma towards the centre of the cell, which represents a distance of 0.6 μm from the plasmalemma.
Figure 8
Figure 8. Effect of a nocodazole treatment on 3-dimensional organization of the endoplasmic reticulum in porcine endothelial cells using BODIPY FL-X ryanodine
Using deconvolution microscopy images were collected from cultured endothelial cells (passage 1) treated for 16 h in the absence (A) or presence (C) of 10 μmol l−1 nocodazole. The corresponding 1 μm thick x-y slice in middle depth after deconvolution is shown in B for image A and in D for image C.
Figure 9
Figure 9. Effect of disruption of superficial ER compartments on bulk Ca2+ signal in response to NaF and a low concentration of bradykinin
Endothelial cells pre-treated with or without nocodazole for 16 h and loaded with fura-2 AM were stimulated with NaF (10 mmol l−1) (A) and a sub-maximal concentration of bradykinin (i.e. 1 nmol l−1; B). Cultured endothelial cells were incubated for 16 h in DMEM in the absence (continuous line, ^) or presence (dashed linel, •) of 10 μmol l−1 nocodazole. Before the experiments, cells were washed three times and loaded with fura-2 AM for 45 min at room temperature in the dark. Experiments were performed in the absence of nocodazole in nominal Ca2+-free buffer. Points represent the means ±s.e.m. (n = 22).
Figure 10
Figure 10. Effect of a pre-treatment of cultured porcine endothelial cells with nocodazole on bulk Ca2+ concentration in cells stimulated with maximal concentration of bradykinin (A) and thapsigargin (B)
Cultured endothelial cells were incubated for 16 h in DMEM in the absence (continuous line, ^) or presence (dashed line, •) of 10 μmol l−1 nocodazole. Before experiments, cells were washed three times and endothelial cells were stimulated in the absence of nocodazole with bradykinin (i.e. 100 nmol l−1; A), and the ER ATPase inhibitor thapsigargin (1 μmol l−1; B). Points represent the means ±s.e.m. (n = 6-9).
Figure 11
Figure 11. Schematic view of the proposed focal, subplasmalemmal Ca2+ elevation by weak stimulation of vascular endothelial cells
Small or slow formation of IP3 by 1 nmol l−1 bradykinin or 10 mmol l−1 NaF initiates vectorial Ca2+ release from the subplasmalemmal endoplasmic reticulum (SER) towards the cell membrane. Under physiological conditions, Ca2+ release by the SER does not diffuse to deeper cytosolic compartments due to plasmalemmal Na+-Ca2+ exchange activity (i.e. subplasmalemmal Ca2+ control unit; SCCU). Thus, no bulk Ca2+ increase is observed. Prevention of plasmalemmal Na+-Ca2+ exchange by low extracellular Na+, allows subplasmalemmal released Ca2+ to diffuse into deeper parts of the cytosol, initiating Ca2+-induced Ca2+ release on the ryanodine receptors, resulting in depletion of IP3-sensitive Ca2+ pool(s) and elevation of bulk Ca2+.

References

    1. Busse R, Mülsch A, Flemming I, Hecker M. Mechanisms of nitric oxide release from the vascular endothelium. Circulation. 1993;87(suppl V):V18–25.
    1. Cabello OA, Schilling WP. Vectorial Ca2+ flux from the extracellular space to the endoplasmic reticulum via a restricted cytoplsamic compartment regulates inositol 1,4,5-trisphosphate-stimulated Ca2+ release from internal stores in vascular endothelial cells. Biochemical Journal. 1993;295:357–366. - PMC - PubMed
    1. Chen Q, Cannell M, Van Breemen C. The superficial buffer barrier in vascular smooth muscle. Canadian The Journal of Physiology and Pharmacology. 1992;70:509–514. - PubMed
    1. Etter EF, Minta A, Poenie M, Fay FS. Near-membrane [Ca2+] transients resolved using the Ca2+ indicator FFP18. Proceedings of the National Academy of Sciences of the USA. 1996;93:5368–5373. 10.1073/pnas.93.11.5368. - DOI - PMC - PubMed
    1. Garzzini E, Guillon G, Chouinard L, Gagnon J-S, Prezeau L, Gallo-Payet N. Dual effects of fluoro-aluminate on activation of calcium influx and inhibition of agonist-induced calcium mobilization in rat glomerulosa cells. Cell Calcium. 1996;19:29–41. 10.1016/S0143-4160(96)90011-1. - DOI - PubMed

Publication types

MeSH terms

LinkOut - more resources