. 1998 Jan 1;506 ( Pt 1)(Pt 1):143-57.
doi: 10.1111/j.1469-7793.1998.143bx.x.

Calcium current during a single action potential in a large presynaptic terminal of the rat brainstem

Affiliations

Calcium current during a single action potential in a large presynaptic terminal of the rat brainstem

J G Borst et al. J Physiol. .

Abstract

1. The calcium current of a 'giant' synaptic terminal (the calyx of Held) was studied using two-electrode voltage clamp in slices of the rat brainstem. 2. In terminals with a long axon (length > 100 microns), the passive current transient decayed biexponentially following voltage steps. In terminals with a short axon (length < 30 microns), the slow component was reduced or absent. These terminals also had small slow calcium tail currents following long depolarizing voltage steps, suggesting that these are largely due to axonal calcium channels. 3. Terminals were voltage clamped with action potential waveform commands. At both 24 and 36 degrees C the calcium current began shortly after the peak of the action potential and ended before the terminal was fully repolarized. 4. The calcium current during the repolarization phase was 69 +/- 1% (n = 3) of maximal, judged from the increase in this current when a plateau phase was added to the action potential waveform. 5. A Hodgkin-Huxley m2 model, based on the measured activation and deactivation of the calcium current, reproduced both the time course and the amplitude increase of the calcium currents during the different action potential waveforms well. 6. The fast gating of the calcium channels in the terminal ensures that they are effectively opened during the repolarization phase of an action potential. This implies that the distance between open calcium channels is minimized, which is in agreement with the view that multiple calcium channels are needed to release a vesicle in this synapse.


Figures
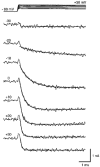
Figure 3
Figure 3. Activation of calcium currents
Same I-V curve as shown in Fig. 2, but filtered at 5 kHz. Top traces, recorded voltages. Holding potential -80 mV. Bottom traces: dotted traces, currents; continuous lines, fit of the onset of the calcium currents with a single exponential function. The fit was started where currents crossed the baseline, following the ‘asymmetry’ currents. Numbers to the right give the command voltage (in mV) during the step. Except for the step to -20 mV, fits are adequate. Time constants of the fits were (ms): 0.04 (-30 mV), 1.95 (-20 mV), 0.90 (-10 mV), 0.44 (0 mV), 0.27 (+10 mV), 0.18 (+20 mV), 0.12 (+30 mV).
Figure 2
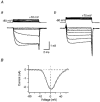
Figure 2. I-V of calcium channels in the absence of an axon
Leak and capacitative currents were subtracted on-line with a P/5 protocol. Filtered at 1 kHz for display. A,current traces (bottom) and voltage traces (top), recorded with two separate pipettes during 10 ms steps from a holding potential of -80 mV. Aa, steps from -70 to +10 mV. Ab, steps from +20 to +70 mV. B, I-V of peak amplitudes of the traces shown in A.
Figure 5
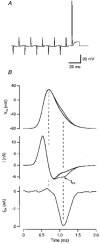
Figure 5. Calcium current during an action potential waveform command
Same terminal as shown in Fig. 1 A. A, command template. The full-sized action potential is preceded by 5 reduced and 5 reduced and inverted action potentials, which were used for subtraction of the passive current. The -10 mV step at the end of the command was used to assess the speed of the voltage clamp. B, top, recorded voltages. Due to series resistance, the repolarization is somewhat slower during the full action potential than during the smaller (summed) action potentials. Middle, currents. The current flowing during the full-sized action potential has a larger inward component (labelled ICa). The two passive transients overlay well. Bottom, calcium current. The calcium current was obtained by subtracting the passive current from the current measured during the full action potential. A small outward current precedes the calcium current. All traces are the average of 11. Vertical dotted lines denote peak of the action potential waveform and of the calcium current.
Figure 1
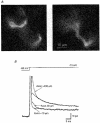
Figure 1. Terminals with and without an axon
A, fluorescent images of a terminal in which the axon length was around 30 μm. Left image shows the calyx (top left) and the tip of the axon, which had been cut at the surface of the slice (lower right). Right image shows the axon, beneath the surface of the slice. B, passive properties. Top, voltage measured with a separate electrode; average of 25 steps from -80 to -70 mV. Bottom, dotted lines, currents digitally filtered at 500 Hz for display. Continuous line is the fit with a single exponential function with a time constant of 7.4 ms. In the terminal that possessed an axon with a length of more than 200 μm, the charging of the membrane had a slow component, which was not present in the terminal in which the axon had been cut less than 10 μm from the terminal. A smaller slow component is present in the calyx shown in A.
Figure 4
Figure 4. Deactivation of calcium currents
After a 5 ms step to 0 mV, the membrane potential was stepped back to potentials between -20 and -60 mV. Top, recorded voltage traces; bottom, currents. Continuous lines are the fit of a single exponential function. The beginning of the fit was 80 μs after the peak of the tail current. Time constants of the fits were (ms): 0.47 (-20 mV), 0.32 (-30 mV), 0.17 (-40 mV), 0.09 (-50 mV), 0.05 (-60 mV). Dotted lines indicate zero current levels for each trace.
Figure 6
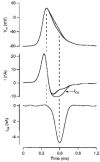
Figure 6. Calcium current during an action potential at 36 °C
Top, recorded voltages. Middle, currents. Bottom, calcium current. See legend of Fig. 5B for further details.
Figure 7
Figure 7. Action potentials open calcium channels effectively
The plateau phase of the action potential waveform was prolonged to find the maximal possible increase in the current during the repolarization phase. To ensure full activation of the calcium currents, action potential waveforms with a plateau phase of +60 mV were also tested. A, top, recorded voltages. Bottom, currents. During the plateau phase at +60 mV inward currents were very small, since this potential is close to the reversal potential of the calcium currents. B, calcium currents during the repolarization phase for the normal action potential waveform (thin trace) and for an action potential waveform with the same peak potential, but with a plateau that lasted 0.72 ms (thick trace), shown at faster time scale than in A. The calcium current was close to maximum with this waveform. C, peak amplitude of the calcium current during the repolarization phase versus plateau length. Amplitudes were normalized to the amplitude that was obtained with the standard action potential waveform, which was -2.9 nA (thick trace in B). Currents were filtered at 2 kHz before amplitudes were measured. •, plateau phase to +60 mV. ^, plateau to +33 mV. Continuous line, fit of open symbols with an exponential function with a time constant of 0.35 ms.
Figure 8
Figure 8. Hodgkin-Huxley model of calcium currents
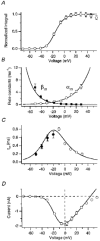
A, averaged normalized tail current integrals after a 10 ms step (n = 7) were used as a measure for the average steady-state activation parameter m¯2. Integration time was 0.5 ms. Continuous line is a fit with a squared Boltzmann function (eqn (3)), with half-activation voltage, Vh, of -23.2 mV and steepness factor, κ, of 9.1 mV. B, rate constants for opening (αm) and closing (βm) of gate m. Continuous lines are the fits with a single exponential function (eqns (6) and (7)), with α0= 1.78 ms−1, Vα= 23.3 mV and β0= 0.140 ms−1, Vβ = 15.0 mV, respectively. C, time constants (τm) measured from activation (^, eqn (2), n = 7) or deactivation (•, eqn (1), n = 4) of the calcium currents. The continuous line gives the time constants calculated from the rate constants of the HH model (shown in B), as τm = 1/(αm + βm). D, average of the 7 I-V relations used for getting the steady-state activation and τm during the onset of the calcium currents. The continuous line is the fit with eqn (10) with maximal conductance gmax = 48.9 nS and reversal potential Vr = 43.9 mV.
Figure 9
Figure 9. Simulation of calcium current during an action potential
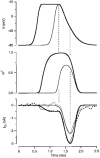
Calcium currents were simulated with the HH model (eqn (8)). The standard action potential template (thin lines) was compared with the waveform that elicited the response shown in Fig. 7B (thick lines). Top, action potential waveforms. The vertical dotted lines give the peak of the action potential and the peak of the simulated calcium current. Middle, open probability (m2) of the calcium channels during the normal action potential (thin line) and the action potential with the plateau phase (thick line). Bottom, currents. Thin line is the simulated current during the standard action potential. For comparison the measured calcium currents that were also shown in Fig. 7B (bottom) have been added (dotted lines). The experimental currents were both multiplied by 0.7 to normalize them to the simulated currents.

References

    1. Augustine GJ. Regulation of transmitter release at the squid giant synapse by presynaptic delayed rectifier potassium current. Journal of Physiology. 1990;431:343–364. - PMC - PubMed
    1. Augustine GJ, Charlton MP, Smith SJ. Calcium entry into voltage-clamped presynaptic terminals of squid. Journal of Physiology. 1985;367:143–162. - PMC - PubMed
    1. Bertram R, Sherman A, Stanley EF. Single-domain/bound calcium hypothesis of transmitter release and facilitation. Journal of Neurophysiology. 1996;75:1919–1931. - PubMed
    1. Borst JGG, Helmchen F. Calcium influx during an action potential. In: Conn PM, editor. Methods in Enzymology. Academic Press; 1998. in the Press. - PubMed
    1. Borst JGG, Helmchen F, Sakmann B. Pre- and postsynaptic whole-cell recordings in the medial nucleus of the trapezoid body of the rat. Journal of Physiology. 1995;489:825–840. - PMC - PubMed

Publication types

Substances

LinkOut - more resources