Review
. 1998 Mar 15;18(6):2147-60.
doi: 10.1523/JNEUROSCI.18-06-02147.1998.

Behavioral studies of sound localization in the cat

Affiliations
Review

Behavioral studies of sound localization in the cat

L C Populin et al. J Neurosci. .

Abstract

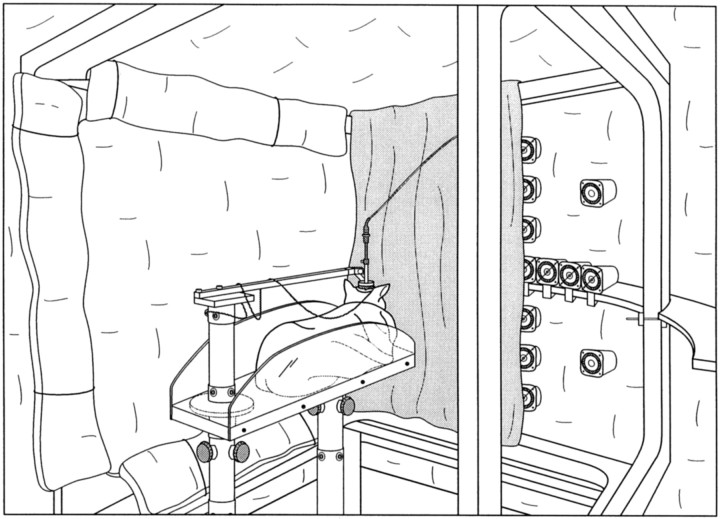
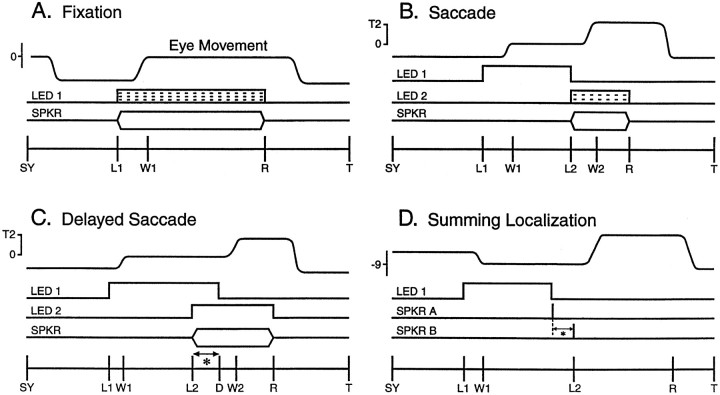
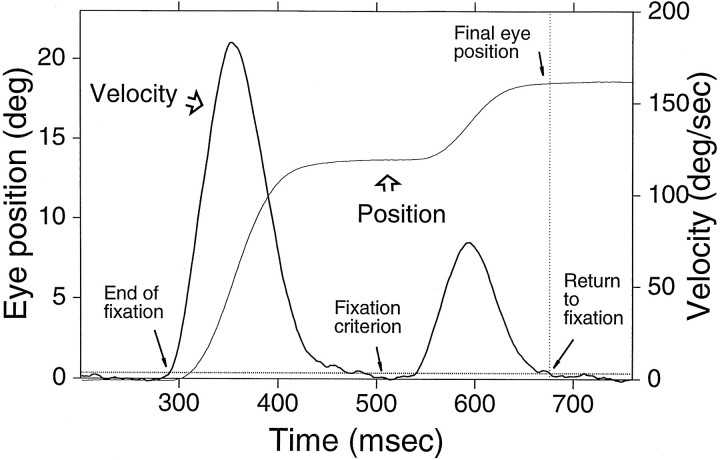
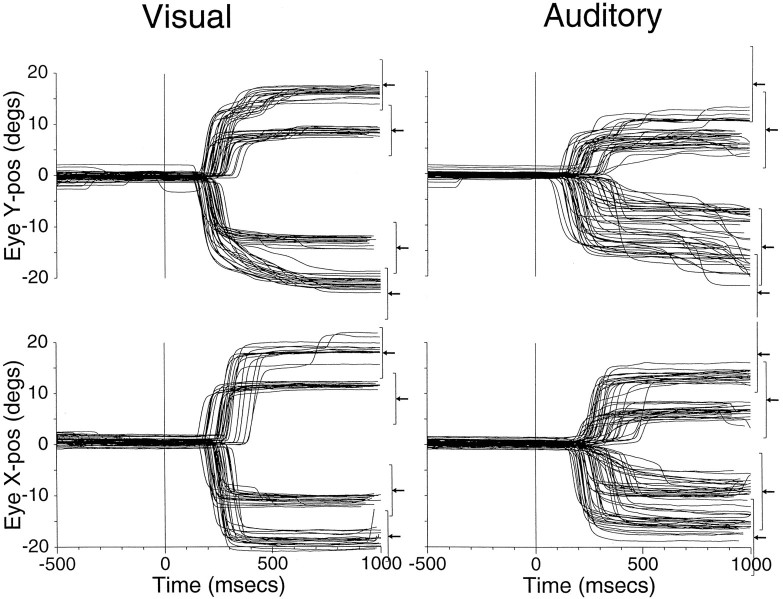
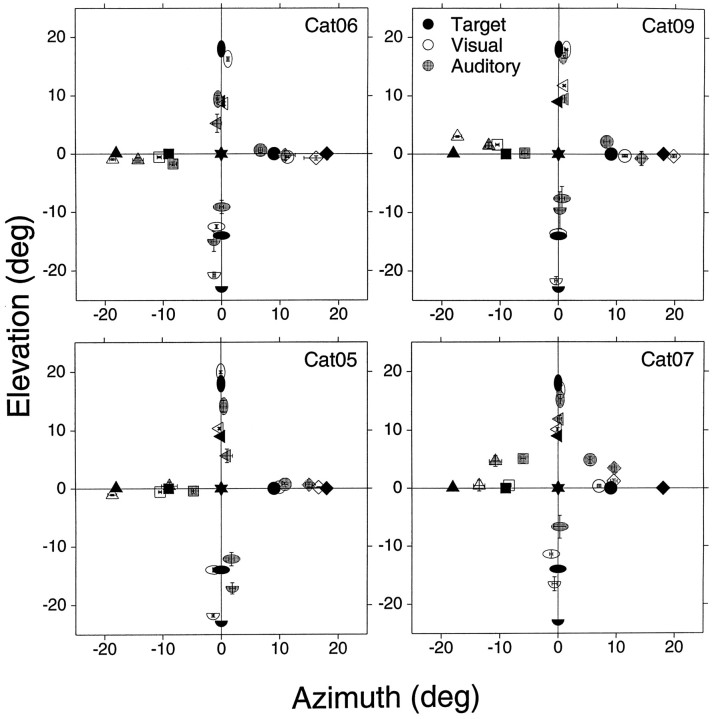
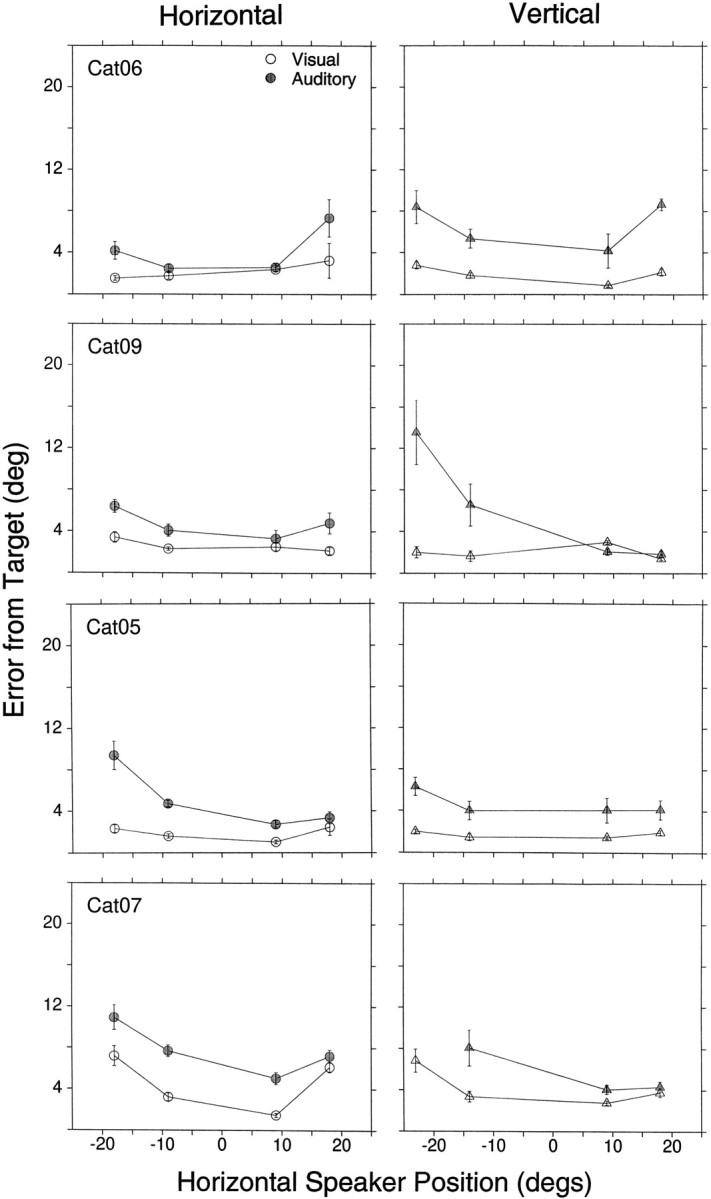
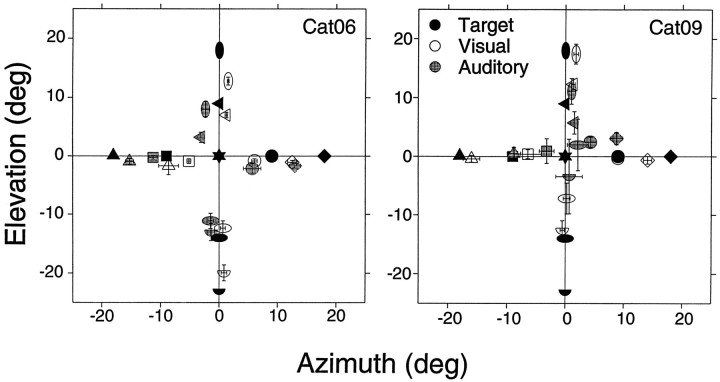
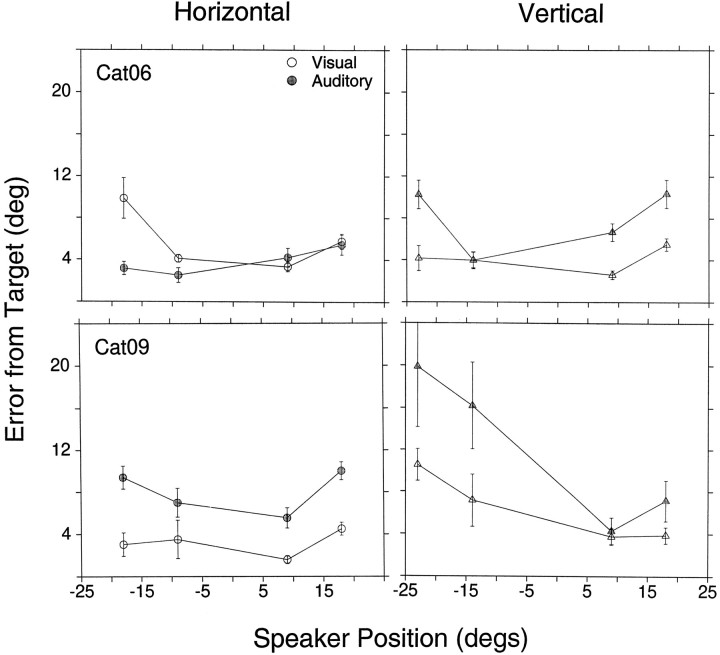
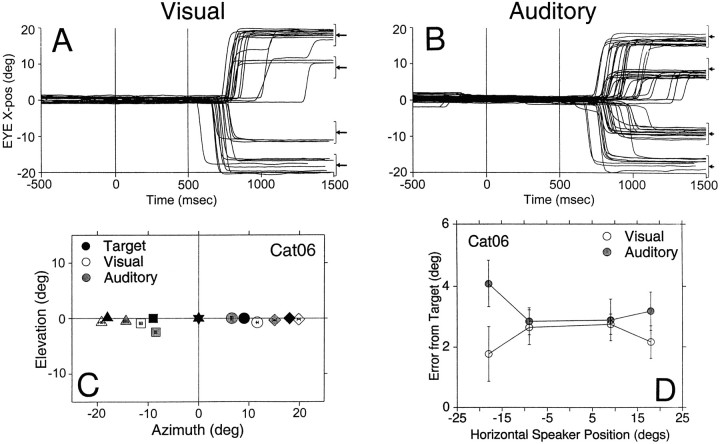
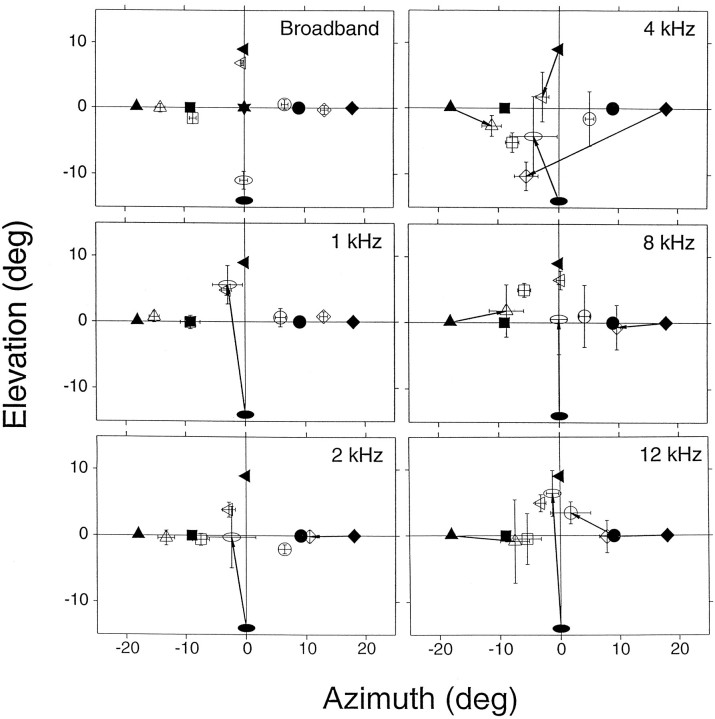
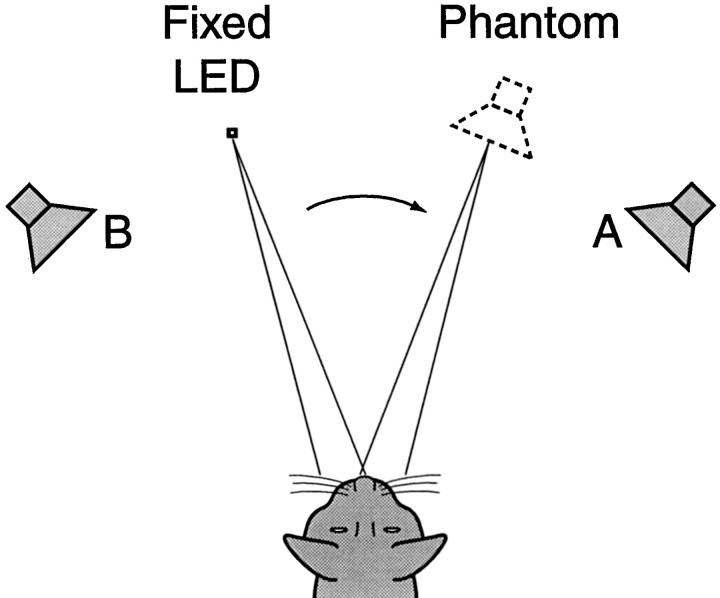
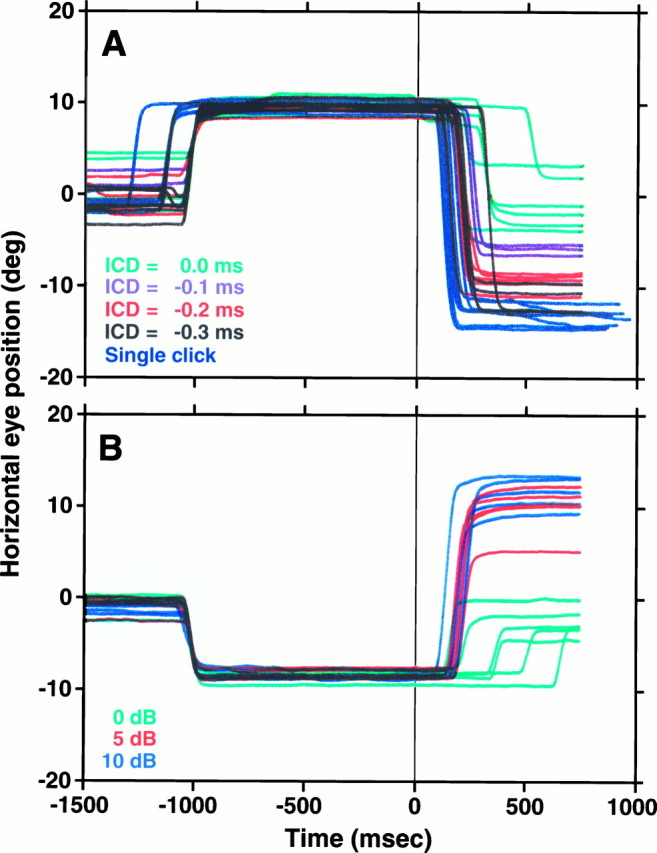
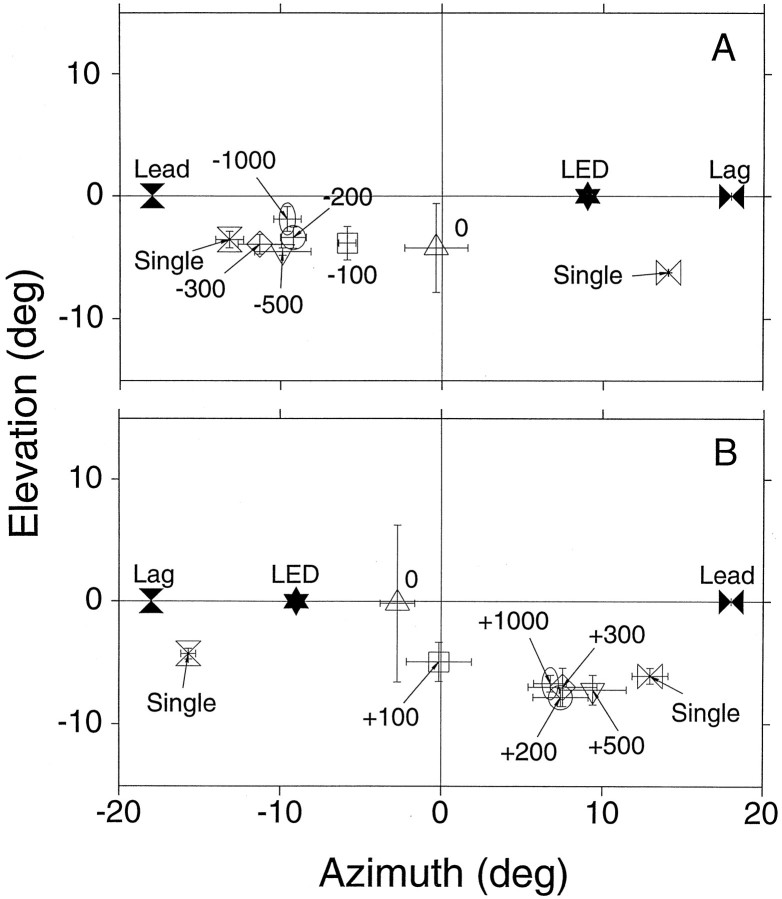
Using the magnetic search coil technique to measure eye and ear movements, we trained cats by operant conditioning to look in the direction of light and sound sources with their heads fixed. Cats were able to localize noise bursts, single clicks, or click trains presented from sources located on the horizontal and vertical meridians within their oculomotor range. Saccades to auditory targets were less accurate and more variable than saccades to visual targets at the same spatial positions. Localization accuracy of single clicks was diminished compared with the long-duration stimuli presented from the same sources. Control experiments with novel auditory targets, never associated with visual targets, demonstrated that the cats localized the sound sources using acoustic cues and not from memory. The role of spectral features imposed by the pinna for vertical sound localization was shown by the breakdown in localization of narrow-band (one-sixth of an octave) noise bursts presented from sources along the midsagittal plane. In addition, we show that cats experience summing localization, an illusion associated with the precedence effect. Pairs of clicks presented from speakers at (+/-18 degrees,0 degrees ) with interclick delays of +/-300 microsec were perceived by the cat as originating from phantom sources extending from the midline to approximately +/-10 degrees.


Figures

Fig. 1.
Fig. 1.
Drawing of the experimental setup. The interior of the recording chamber and the cubic frame housing the field coils of the magnetic search coil system are covered with foam to attenuate acoustic reflections; some panels have been removed for illustrative purposes. A cat is shown inside a canvas bag on a platform with its head fixed from behind by the holding bar. This animal was prepared for physiological recordings with a microdrive mounted on a recording chamber on top of the head. Multiple acoustic speakers are mounted in front of the cat behind a black cheesecloth curtain with LEDs positioned at the center of most of the speakers.
Fig. 2.
Fig. 2.
Schematic diagram of the behavioral tasks. A, Fixation; B, saccade; C, delayed saccade; and D, summing localization. Each panel shows the following fromtop to bottom: the expected eye movement, visual (LED) and auditory (SPKR) target onset and offset, and the sequence of the behavioral events. Targets could be visual, auditory, or combined modality. SY, Synchronization pulse stored in the computer record to mark start of the trial; L1, fixation LED onset; W1, W2, eye into acceptance window; D, delay;L2, target onset; R, reward;T, end of trial. A, Fixation task. The animal was required to saccade to the target and to maintain fixation within the acceptance window surrounding the target. The broken lines within the LED represent the progressive dimming of the visual component of the combined stimuli used during the early stages of sound localization training. B, Saccade task. At the end of the fixation event (LED 1), another target was presented at a different location. To receive a reward the cat had to fixate LED 1 and then saccade to the location of the newly presented target until the reward (R) was delivered. C, Delayed saccade. The target was presented before the offset of the fixation event (LED 1). The signal for the cat to move to the target was given by theoffset of LED 1; thus the delay, indicated by the asterisk, is the time during whichLED 1 and target (LED 2 orSPKR) overlap. D, Summing localization. Coinciding with the end of a fixation event (LED 1), a pair of 100 μsec clicks is presented from two speakers at (±18°,0°) with ICDs (indicated by the asterisk) ranging over ±1000 μsec.
Fig. 3.
Fig. 3.
Criterion for determining the return to fixation. Horizontal eye position (thin trace) and velocity (heavier trace) from a visual trial to a target located at (18°,0°) are plotted as a function of time. Thehorizontal dotted line illustrates the fixation criterion. The vertical dotted line, drawn at the point at which the velocity trace intersects the fixation criterion line, illustrates the return to fixation. Final eye position is defined as the position at the time of return to fixation.
Fig. 4.
Fig. 4.
Typical eye movements of Cat06 to visual and auditory targets during the saccade task. The main component, either vertical or horizontal, of successful eye movements from the primary position (0°,0°) to targets located along the main vertical (0°,18°; 0°,9°; 0°,−14°; 0°,−23°) and horizontal (±18°,0°; ±9°,0°) axes are plotted as a function of time and synchronized to stimulus onset (time, 0 msec); failed trials are omitted for clarity. The arrows to theright illustrate the position of the target for the component plotted, and the brackets illustrate the sizes of the acceptance window (±5° for visual, ±7.5° for auditory) surrounding each target. The number of trials included is given byn = 344 (183 auditory and 161 visual).
Fig. 5.
Fig. 5.
Mean final eye position summary for visual (open symbol) and auditory (stippled symbols) noise stimuli from four different cats with different degrees of training (Cat06, sessions 120–121; Cat09, sessions 4–7; Cat07, sessions 60–64; Cat05, sessions 72–79) to eight different targets (filled symbols). The standard saccade task started from the primary position (0°,0°). Bars represent the confidence interval (2 × SE of sample mean) computed for the (x,y) dimensions independently.n = 1679 trials (Cat06, 462; Cat05, 476; Cat07, 346; Cat09, 395).
Fig. 6.
Fig. 6.
Mean absolute magnitude of localization errors to long-duration stimuli. Stippled symbols represent auditory (broad-band noise) data, and hollow symbols represent visual data.
Fig. 7.
Fig. 7.
Mean final eye position summary for transient stimuli of two cats. Visual, 25 msec; auditory, single 100 μsec click. n = 1034 (Cat06, 839; Cat09, 195). Details as in Figure 5.
Fig. 8.
Fig. 8.
Mean absolute magnitude of localization errors of transient stimuli. Data from two cats (Cat06, sessions 125–137; Cat09, sessions 15–20) are shown. Details as in Figure 6.
Fig. 9.
Fig. 9.
Sound localization with delayed saccade (Cat06; sessions 125–126). Horizontal eye position from successful trials to visual (A) and auditory (B) targets are plotted synchronized to the onset of the stimulus (thin vertical line at time 0 msec). The second vertical line at 500 msec marks the offset of the fixation light. C, D, Mean final eye position and magnitude of localization error, respectively (n = 196). Details as in Figures 5 and 6.
Fig. 10.
Fig. 10.
Sound localization control experiment. Speakers were shifted 4.5° eccentrically in a single session (Cat06). The standard speaker positions are represented by the filled triangle (9°,0°) and circle (18°,0°), and the test positions are represented by the filled square (13.5°,0°) and diamond(22.5°,0°). The mean final eye position for each target is represented by the corresponding open symbols (± confidence interval).
Fig. 11.
Fig. 11.
Localization of bandpass noise stimuli (Cat06): mean final eye position summaries for localization of broad-band and bandpass stimuli, one-sixth of an octave wide bands centered at 1, 2, 4, 8, and 12 kHz. The filled symbols represent the position of the targets, and the open symbols represent the corresponding mean final eye positions. The arrowsconnect the targets with their corresponding final eye positions when the errors were >7°. n = 263 for bandpass stimuli. Bars represent confidence intervals.
Fig. 12.
Fig. 12.
Schematic representation of the summing localization experiment. Pairs of clicks were presented from speakersA and B with an interclick delay of <1000 μsec. In humans, these stimuli are perceived as a single auditory event, originating from a “phantom” source, localized to the side of the leading speaker. In this example, with the click from speaker A leading the click from speakerB, the cat is initially required to fixate an LED to the left to facilitate an overt response.
Fig. 13.
Fig. 13.
Summing localization. Horizontal eye position traces are plotted synchronized to the onset of the acoustic stimuli at time 0 msec. A, ICD series:turquoise, 0 μsec; purple, −100 μsec; red, −200 μsec; black, −300 μsec; blue, single clicks. The cat was required to fixate an LED at (9°,0°) for 1000 msec and then was expected to saccade where it perceived sound to originate. B, Intensity series. The independent variable was the attenuation of the clicks presented from the speaker at (−18°,0°):turquoise, 0 dB; red, 5 dB;blue, 10 dB; thus the cat was required to initially fixate an LED at (−9°,0°). With nonzero attenuations the phantom sources were expected to be perceived to the right of the midline. Data from the mirror image experiments are not shown.
Fig. 14.
Fig. 14.
Summing localization: ICD series summary. Mean final eye position from the negative (A;n = 36 trials) and the positive (B;n = 42 trials) ICD conditions. The position of the fixation LED is illustrated by a filled star; the position of the leading (Lead) and lagging (Lag) speakers are labeled. The mean final eye positions for the various ICDs are illustrated by the open symbols. Bars represent the confidence intervals computed as in Figure 5. The point for the single click presented from the right speaker in A represents two data points only.

References

    1. Beitel RE, Kaas JH. Effects of bilateral and unilateral ablation of auditory cortex in cats on the unconditioned head orienting response to acoustic stimuli. J Neurophysiol. 1993;70:351–369. - PubMed
    1. Blauert J. Spatial hearing: the psychophysics of human sound localization. MIT; Cambridge, MA: 1983.
    1. Butler RA. The influence of the external and middle ear on auditory discriminations. In: Keidel WD, Neff WD, editors. Handbook of sensory physiology, V, Auditory System, Pt 2. Springer; Berlin: 1975. pp. 247–260.
    1. Casseday JH, Neff WD. Localization of pure tones. J Acoust Soc Am. 1973;54:365–372. - PubMed
    1. Cranford JL. Localization of paired sound sources in cats: effects of variable arrival times. J Acoust Soc Am. 1982;72:1309–1311. - PubMed

Publication types

LinkOut - more resources