Review
. 1998 Mar 15;18(6):2161-73.
doi: 10.1523/JNEUROSCI.18-06-02161.1998.

Fibrillar beta-amyloid induces microglial phagocytosis, expression of inducible nitric oxide synthase, and loss of a select population of neurons in the rat CNS in vivo

Affiliations
Review

Fibrillar beta-amyloid induces microglial phagocytosis, expression of inducible nitric oxide synthase, and loss of a select population of neurons in the rat CNS in vivo

D T Weldon et al. J Neurosci. .

Abstract

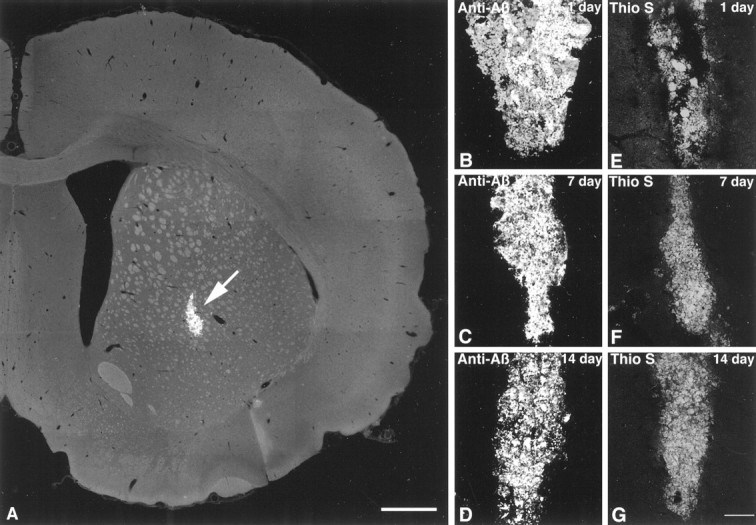
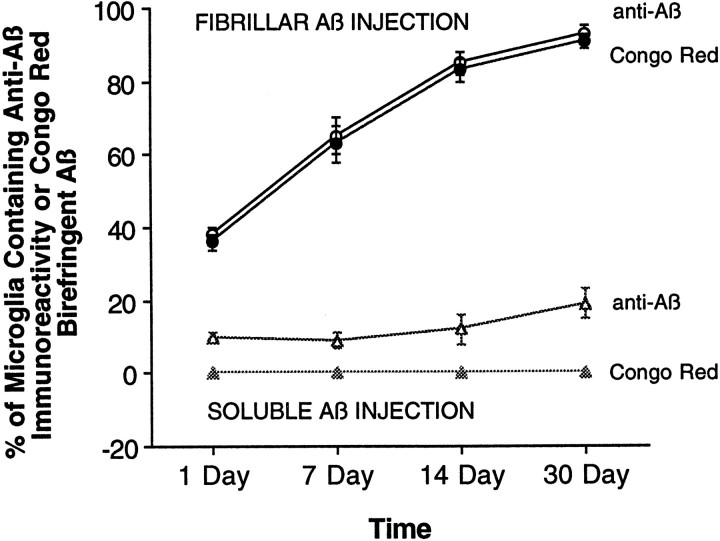
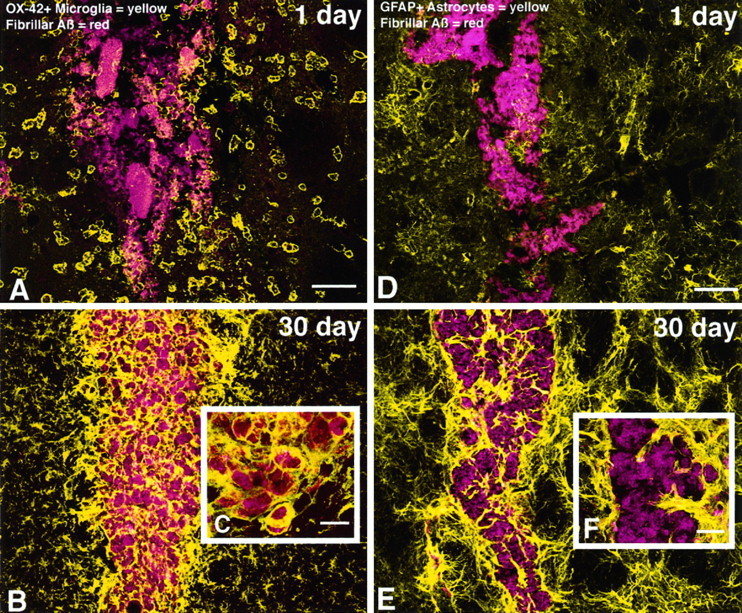
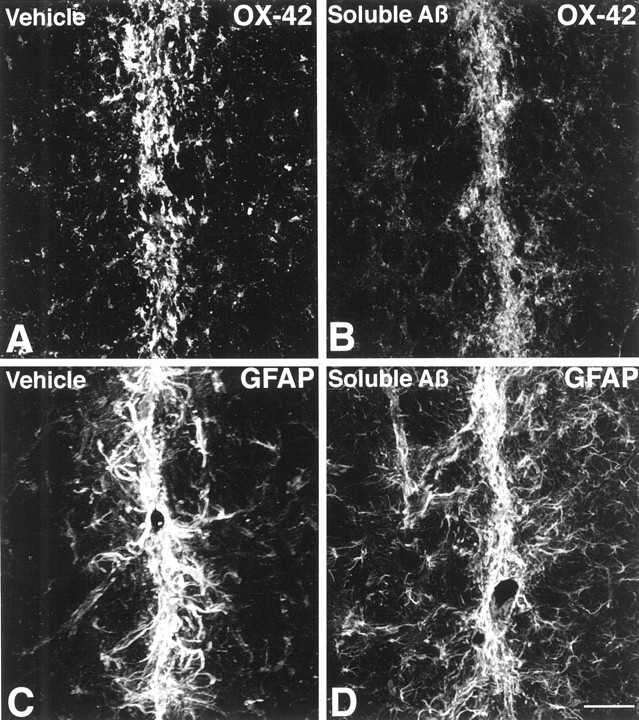
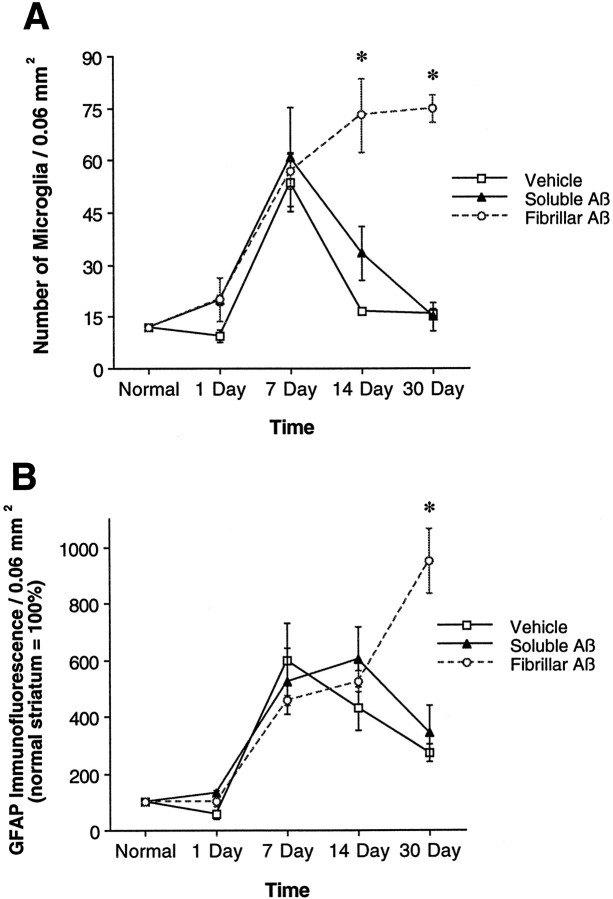
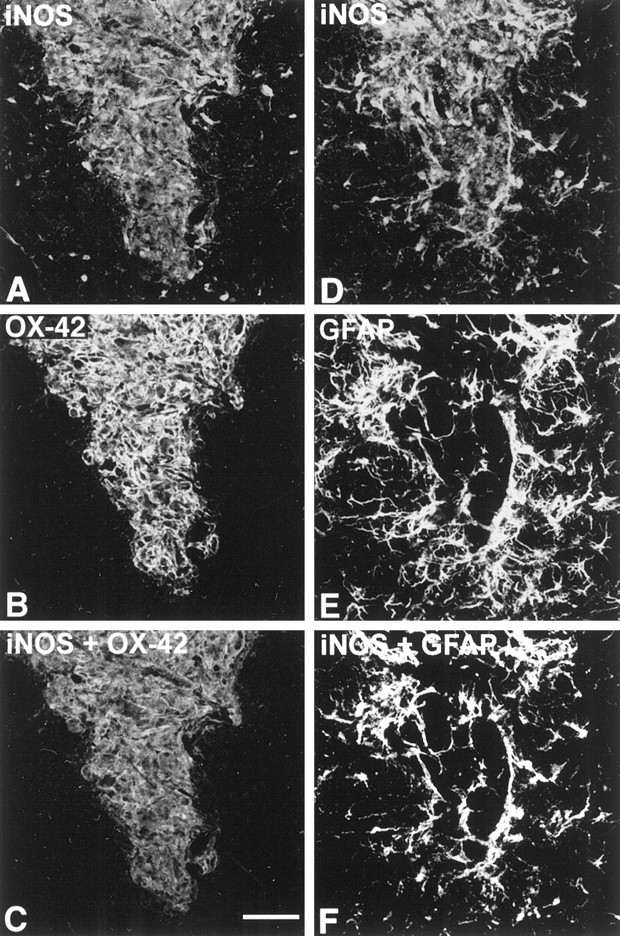
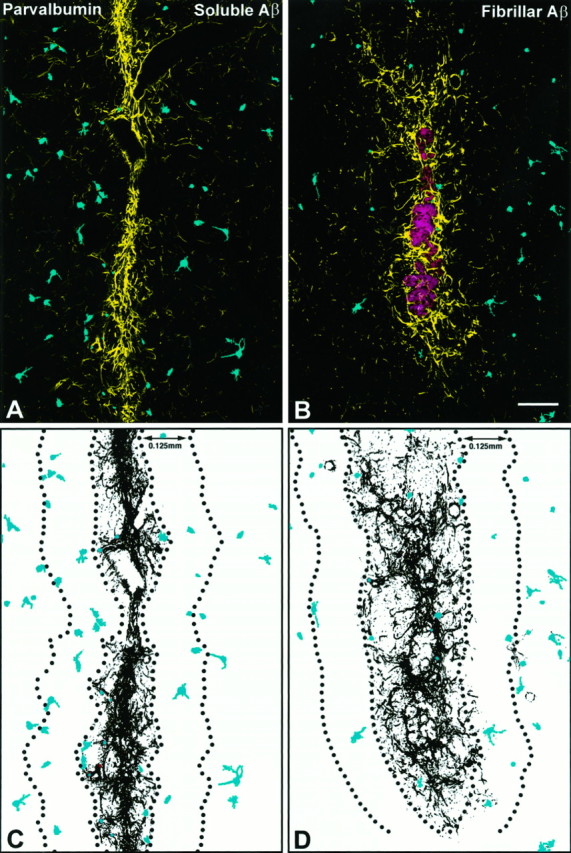
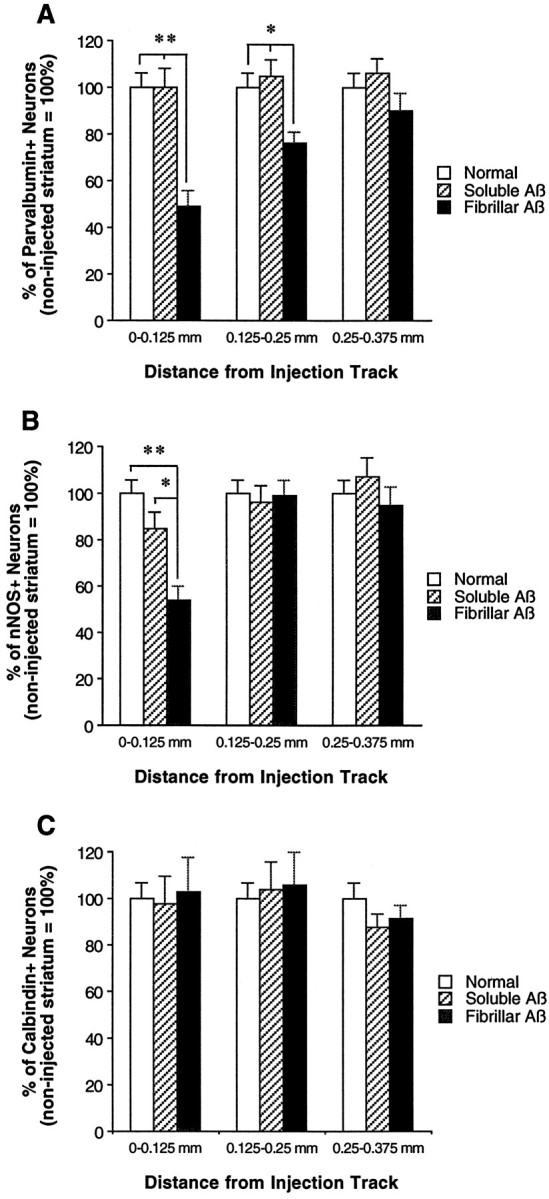
To determine the stability of beta-amyloid peptide (Abeta) and the glial and neuronal changes induced by Abeta in the CNS in vivo, we made single injections of fibrillar Abeta (fAbeta), soluble Abeta (sAbeta), or vehicle into the rat striatum. Injected fAbeta is stable in vivo for at least 30 d after injection, whereas sAbeta is primarily cleared within 1 d. After injection of fAbeta, microglia phagocytize fAbeta aggregates, whereas nearby astrocytes form a virtual wall between fAbeta-containing microglia and the surrounding neuropil. Similar glial changes are not observed after sAbeta injection. Microglia and astrocytes near the injected fAbeta show a significant increase in inducible nitric oxide synthase (iNOS) expression compared with that seen with sAbeta or vehicle injection. Injection of fAbeta but not sAbeta or vehicle induces a significant loss of parvalbumin- and neuronal nitric oxide synthase-immunoreactive neurons, whereas the number of calbindin-immunoreactive neurons remains unchanged. These data demonstrate that fAbeta is remarkably stable in the CNS in vivo and suggest that fAbeta neurotoxicity is mediated in large part by factors released from activated microglia and astrocytes, as opposed to direct interaction between Abeta fibrils and neurons.


Figures

Fig. 1.
Fig. 1.
A, A confocal photomicrograph shows the location of fAβ injection into the rat striatum. The fAβ shown here (arrow) was prelabeled with thioflavin S before injection anterior 0.5 mm, lateral 3.0 mm, and ventral 6.5 mm relative to bregma (Paxinos and Watson, 1986). The image was constructed from six optical sections acquired at 1.0 μm intervals using a 4× lens.B–G, Fluorescent confocal images of injected fAβ in the striatum show that fAβ is stable in vivo.B–D, Injected fAβ is identified in tissue by labeling with anti-Aβ. E–G, Injected fAβ prelabeled with thioflavin S is also readily observable in the striatum. Note that, although variability in the shape of the injection site is evident in the images, there is little decrease in the total amount of injected fAβ present over time. Also, no significant decrease in thioflavin S fluorescence is observed over time, suggesting injected fAβ monomers are not being replaced with endogenous rat Aβ. Images were projected from six optical sections acquired at 1.0 μm intervals using a 10× lens. Scale bars: A, 1.0 mm; B–G, 75 μm.
Fig. 2.
Fig. 2.
Aβ is phagocytized by microglia over time. Fluorescent confocal images of fAβ (circles) or sAβ (triangles) labeled with anti-Aβ were merged with confocal images of OX-42-immunoreactive microglia from the same tissue sections, allowing intracellular resolution and quantification of Aβ inside microglia. Microglia actively phagocytize fAβ over time, because 93% of microglia within 150 μm of the fAβ needle track contain material that is both Aβ-immunoreactive and Congo red-birefringent at 30 d after injection. In contrast, a relatively small percentage of microglia (10–20%) within 150 μm of the sAβ needle track contain Aβ immunoreactivity at the observed time points; this Aβ-immunofluorescent material is neither Congo red-birefringent nor thioflavin S-positive (data not shown) and thus lacks the characteristics of fAβ.
Fig. 3.
Fig. 3.
Fluorescent confocal images show that microglia actively phagocytize injected fAβ, whereas astrocytes wall-off fAβ-containing microglia from the surrounding neuropil.A–C, fAβ prelabeled with thioflavin S appearsred, and microglia labeled with anti-CD11b (OX-42) appear yellow. A, At 1 d after injection, activated microglia, characterized by short, thickened processes and marked cytoplasmic swelling, are observed surrounding injected fAβ. Note that some of these microglia are associated with injected fAβ along the outer margins of the needle track.B, C, At 30 d after injection, fAβ is not cleared from the site of injection but rather is contained almost exclusively within microglia in the needle track.D–F, fAβ prelabeled with thioflavin S appearsred, and astrocytes labeled with anti-GFAP appearyellow. D, At 1 d after injection, no significant astrogliosis is observed surrounding injected fAβ.E, F, In contrast, a marked astrogliosis, characterized by activated astrocytes with swollen processes and increased GFAP immunofluorescence, is observed at 30 d after injection. Astrocytes are shown walling-off fAβ-containing microglia from surrounding tissue. Images of fAβ and microglia or astrocytes were taken from the same double-labeled tissue sections. Images were projected from 12 optical sections acquired at 1.0 μm intervals using a 10× or 40× lens. Scale bars: A, B,D, E, 50 μm; C,F, 10 μm.
Fig. 4.
Fig. 4.
Microglia and astrocyte responses 30 d after vehicle or sAβ injection are shown. A,B, No difference in OX-42 immunofluorescence is observed in the needle track after vehicle or sAβ injection. C,D, Similarly, no difference in GFAP immunofluorescence is observed in the needle track after vehicle or sAβ injection. Images are Kalman averages of a single optical section acquired using a 20× lens. Scale bar, 50 μm.
Fig. 5.
Fig. 5.
Injected fAβ induces a larger and more-sustained gliosis compared with that seen with injected sAβ or vehicle alone.A, The number of OX-42-immunoreactive microglia, quantified in 0.06 mm2 grids centered on fAβ (open circles), sAβ (closed triangles), or vehicle (open squares) needle tracks, is similar at 1 and 7 d after injection but is significantly increased in the fAβ injection area relative to the sAβ and vehicle injection areas at 14 and 30 d after injection. Note that at 1 d after injection, the number of microglia in the fAβ, sAβ, or vehicle injection area does not differ significantly from the number of microglia present in a comparable area of normal striatum.B, Astrogliosis, measured by computing the total intensity of GFAP immunofluorescence in 0.06 mm2grids centered on fAβ (open circles), sAβ (closed triangles), or vehicle (open squares) needle tracks, is similar at 1, 7, and 14 d after injection. At 30 d after injection, GFAP immunofluorescence is significantly increased in the fAβ injection area relative to the sAβ and vehicle injection areas. Images used for microglia counts and GFAP immunofluorescence measurements were Kalman averages of a single optical section acquired using a 10× lens (*fAβ vs sAβ or vehicle, both p < 0.05).
Fig. 6.
Fig. 6.
iNOS expression by microglia and astrocytes is increased 30 d after fAβ injection. A,B, D, E, Tissue sections were labeled with anti-iNOS and with either OX-42 or anti-GFAP.C, F, Using the National Institutes of Health Image 1.51 software program, we merged iNOS and OX-42 or GFAP images, and the area of maximum signal overlap between the images was computed to show immunofluorescence colocalization. Note that microglia in the fAβ injection area, which were shown in Figure 3 to contain fAβ, also express iNOS at 30 d after injection, whereas most microglia outside the injection area do not. Also note that only those astrocytes forming a virtual wall around the injected area, within 100 μm of the Aβ-containing microglia, express high levels of iNOS. The iNOS, OX-42, and GFAP images were taken from the same double-labeled tissue sections and are Kalman averages of a single optical section acquired using a 10× lens. Scale bar, 50 μm.
Fig. 7.
Fig. 7.
Injection of fAβ induces a reduction in the number of parvalbumin-immunoreactive neurons. A,B, Anti-parvalbumin and anti-GFAP were used to label parvalbumin neurons (blue) and the astrogliosis (yellow) surrounding sAβ and fAβ needle tracks. A, C, Note that in tissue areas surrounding injected sAβ, parvalbumin neurons are evenly distributed outward from the margin of the astrogliosis. B,D, In contrast, a significant reduction in the number of parvalbumin neurons is observed near the astrogliosis surrounding injected fAβ (red; image of fAβ from a serial section labeled with anti-Aβ). Images of parvalbumin neurons and astrocytes were taken from the same double-labeled tissue sections and are Kalman averages of a single optical section acquired using a 10× lens. Scale bar, 125 μm.
Fig. 8.
Fig. 8.
Injected fAβ induces a reduction in the number of parvalbumin- and nNOS- but not calbindin-immunoreactive neurons.A–C, Subpopulations of striatal neurons were labeled on separate tissue sections using anti-parvalbumin, anti-nNOS, or anti-calbindin, and on all sections the needle track was double-labeled using anti-GFAP. Numbers of parvalbumin-, nNOS-, and calbindin-immunoreactive neurons are compared over identical areas around sAβ and fAβ needle tracks at 30 d after injection and in the normal (noninjected) striatum. A, A significant reduction in the number of parvalbumin-immunoreactive neurons is observed up to 250 μm from the margin of the fAβ injection track relative to the sAβ injection track and normal striatum.B, In the fAβ injection area, a significant reduction is also observed in the number of nNOS-immunoreactive neurons up to 125 μm from the injection track relative to the sAβ injection track and normal striatum. C, In contrast, no significant difference in the number of calbindin-immunoreactive neurons is observed when comparing fAβ and sAβ injection areas and the normal striatum. (**p < 0.01; *p < 0.05)

References

    1. Adamson DC, Wildemann B, Sasaki M, Glass JD, McArthur JC, Christov VI, Dawson TM, Dawson VL. Immunologic NO synthase–elevation in severe AIDS dementia and induction by HIV-1 Gp41. Science. 1996;274:1917–1921. - PubMed
    1. Akiyama H, Schwab C, Kondo H, Mori H, Kametani F, Ikeda K, McGeer PL. Granules in glial cells of patients with Alzheimer’s disease are immunopositive for C-terminal sequences of beta-amyloid protein. Neurosci Lett. 1996;206:169–172. - PubMed
    1. Ard MD, Cole GM, Wei J, Mehrle AP, Fratkin JD. Scavenging of Alzheimer’s amyloid beta-protein by microglia in culture. J Neurosci Res. 1996;43:190–202. - PubMed
    1. Barron KD. The microglial cell. A historical review. J Neurol Sci. 1995;134:57–68. - PubMed
    1. Bennett BD, Bolam JP. Two populations of calbindin D28k-immunoreactive neurones in the striatum of the rat. Brain Res. 1993;610:305–310. - PubMed

Publication types

MeSH terms

LinkOut - more resources