Review
. 1998 Mar 15;18(6):2200-11.
doi: 10.1523/JNEUROSCI.18-06-02200.1998.

Refractoriness and neural precision

Affiliations
Review

Refractoriness and neural precision

M J Berry 2nd et al. J Neurosci. .

Abstract

The response of a spiking neuron to a stimulus is often characterized by its time-varying firing rate, estimated from a histogram of spike times. If the cell's firing probability in each small time interval depends only on this firing rate, one predicts a highly variable response to repeated trials, whereas many neurons show much greater fidelity. Furthermore, the neuronal membrane is refractory immediately after a spike, so that the firing probability depends not only on the stimulus but also on the preceding spike train. To connect these observations, we investigated the relationship between the refractory period of a neuron and its firing precision. The light response of retinal ganglion cells was modeled as probabilistic firing combined with a refractory period: the instantaneous firing rate is the product of a "free firing rate, " which depends only on the stimulus, and a "recovery function," which depends only on the time since the last spike. This recovery function vanishes for an absolute refractory period and then gradually increases to unity. In simulations, longer refractory periods were found to make the response more reproducible, eventually matching the precision of measured spike trains. Refractoriness, although often thought to limit the performance of neurons, may in fact benefit neuronal reliability. The underlying free firing rate derived by allowing for the refractory period often exceeded the observed firing rate by an order of magnitude and was found to convey information about the stimulus over a much wider dynamic range. Thus, the free firing rate may be the preferred variable for describing the response of a spiking neuron.


Figures

Fig. 1.
Fig. 1.
Firing events in the response of a salamander retinal ganglion cell to random flicker stimulation at 35% contrast.A, The stimulus intensity in units of the mean during a 0.6 sec interval of the 60 sec stimulus repeat. B, Spike raster for 60 repeated trials of the stimulus. C, The observed firing rate r(t), computed by histogramming spike times in 2 msec bins.
Fig. 2.
Fig. 2.
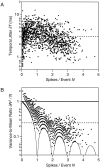
The precision of timing and spike number in firing events from a single ganglion cell. During an 800 sec flicker segment repeated 30 times, 1663 firing events were identified.A, The temporal jitter δT of a firing event as a function of its mean spike count N(dots). The median temporal jitter τ is shown by the dashed line. B, The variance-to-mean ratio δN2/N of the spike count in a firing event as a function of its mean spike countN (dots), along with the value expected from Poisson statistics (thick line), and the Fano factor F (dashed line). The thin line shows the lower bound imposed by the spike count being an integer on individual trials. Note that the data points trace out a series of arches on and above the lower bound that are, successively, the next lowest possible variance-to-mean ratios.
Fig. 3.
Fig. 3.
Schematic illustration of the derivation ofW(t), the probability of free firing. On each trial j,Wj(t) (solid gray) has a value of zero during the refractory period following a spike (vertical lines) and one elsewhere. This function is averaged over all trials (bottom), to yield W(t), the fraction of trials during which free firing was possible at time t.
Fig. 4.
Fig. 4.
Illustration of the method for determining the recovery function wm(t) from the spike train of a ganglion cell. A, The histogram of interspike intervals Δ (diamonds) is fit over the range Δ = 5–10 msec with an exponential curve P(Δ) ∝ eqΔ(solid line), yielding a decay rate ofq = 780 Hz. B, This value ofq serves to compute the recovery functionwm(t) using Equation 17. For intervals >10 msec, P(Δ) was approximated by the exponential extrapolation shown in A.
Fig. 5.
Fig. 5.
Comparison of the model with an absolute refractory period to observed results from a single representative ganglion cell. Six statistics of the spike trains produced by the model are plotted as a function of the absolute refractory period μ. The value of each statistic was averaged over 10 sets of simulated spike trains, and error bars denote ± 1 SD. In each panel, the real value from the neuron is shown by a dashed line.A, The average firing rater¯μ; B, the mean-squared error Eμ (solid symbols) and the uncertainty Eμ0(open symbols) in the simulated firing rate, with the corresponding uncertainty E0 in the measured rate (dashed line); C, the Fano factor Fμ; D, the temporal jitter τμ; E, the noise entropy per unit time Sμnoise; F, the information per spike SμtotalSμnoise)/r¯μ.
Fig. 6.
Fig. 6.
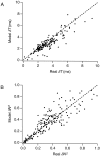
Comparison of the model with a relative refractory period to observed results from a single representative ganglion cell. A, The predicted temporal jitter δTm plotted as a function of the observed value δT for 213 firing events (dots).B, The predicted spike number variance δNm2 plotted as a function of the observed value δN2 (dots). In each panel, the identity relation is shown as a dashed line.
Fig. 7.
Fig. 7.
Performance of the model with a relative refractory period and the nonrefractory model for a population of 42 ganglion cells from three retinae. In each panel, a statistic derived from simulated spike trains is plotted against the observed value from the same cell; the identity relation is shown as a dashed line. A, The Fano factorFm (open circles) andFμ=0 (solid squares) as a function of F. B, The temporal jitter τm (open circles) and τμ=0 (solid squares) as a function of τ. C, The discrepancy in the noise entropy ΔSmnoise =SmnoiseSnoise (open circles) and ΔSμ=0noise= Sμ=0noiseSnoise (solid squares) as a function of Snoise.
Fig. 8.
Fig. 8.
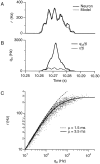
A, The observed firing rater(t) (solid line) and the simulated firing raterm(t) (dashed line) generated by the model with relative refractory period for a single firing event. B, The observed firing rater(t) (thin line) and the free firing rateqm(t) (thick line) for the same firing event. Each curve was computed with 0.25 msec bins, for greater time resolution, and then boxcar-smoothed over nine bins to roughly correspond to the 2 msec bins used elsewhere. C, The observed firing rater(t) computed in 2 msec bins plotted against the corresponding values of the free firing rateqm(t) (dots). Also shown is the steady-state relation r =q/(1 + qμ) for absolute refractory periods of μ = 1.5 msec (dashed line) and μ = 3.5 msec (solid line).
Fig. 9.
Fig. 9.
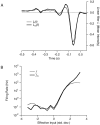
Analysis of the light response for the observed firing rate r(t) and the free firing rate qm(t).A, The linear filter relating the light stimulus to the effective input: L(t) for the observed firing rate (thin line) andLm(t) for the free firing rate (thick line). B, The response function relating the effective input to the firing rate:f(Z) for the observed firing rate (thin line) andfm(Zm) for the free firing rate (thick line).f(Z) was obtained by plotting values of r(t) againstZ(t) every 5 msec, and then binning the range of Z at intervals of ΔZ = 0.4 SD. Thus,f(Z) is the average value ofr(t) over all time points that have an effective input Z(t) between Z − ΔZ/2 andZ + ΔZ/2. The same procedure was followed with qm(t) andZm(t) to obtainfm(Zm).

References

    1. Abeles M. Corticonics: neural circuits of the cerebral cortex. Cambridge UP; Cambridge: 1991.
    1. Bair W, Koch C, Newsome W, Britten K. Power spectrum analysis of bursting cells in area MT in the behaving monkey. J Neurosci. 1994;14:2870–2892. - PMC - PubMed
    1. Baylor DA, Fettiplace R. Synaptic drive and impulse generation in ganglion cells of turtle retina. J Physiol (Lond) 1979;288:107–127. - PMC - PubMed
    1. Berry MJ, Warland DK, Meister M. The structure and precision of retinal spike trains. Proc Natl Acad Sci USA. 1997;94:5411–5416. - PMC - PubMed
    1. Bi Q. A closed-form solution for removing the dead time effects from the poststimulus time histograms. J Acoust Soc Am. 1989;85:2504–2513. - PubMed

Publication types

MeSH terms

LinkOut - more resources