

Protein hydration in solution: experimental observation by x-ray and neutron scattering
- PMID: 9482874
- PMCID: PMC19315
- DOI: 10.1073/pnas.95.5.2267
Protein hydration in solution: experimental observation by x-ray and neutron scattering
Abstract
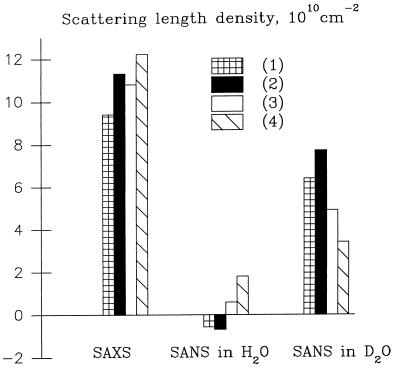
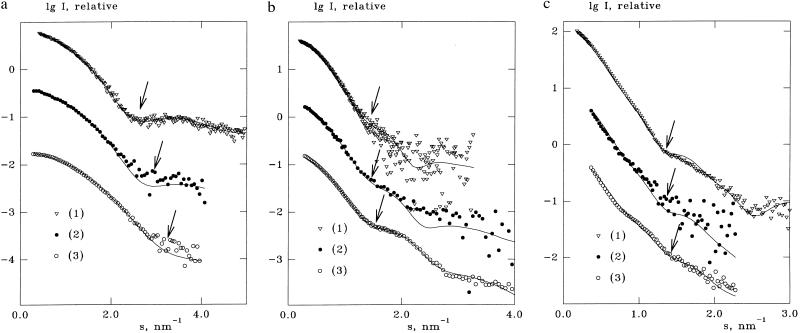
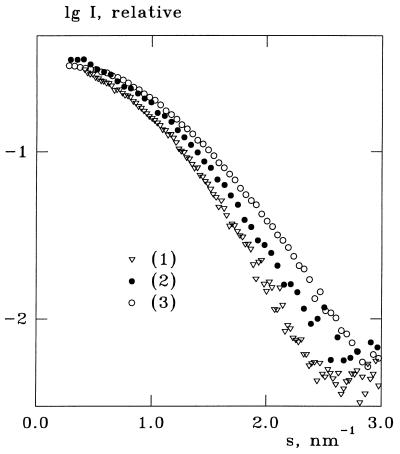
The structure of the protein-solvent interface is the subject of controversy in theoretical studies and requires direct experimental characterization. Three proteins with known atomic resolution crystal structure (lysozyme, Escherichia coli thioredoxin reductase, and protein R1 of E. coli ribonucleotide reductase) were investigated in parallel by x-ray and neutron scattering in H2O and D2O solutions. The analysis of the protein-solvent interface is based on the significantly different contrasts for the protein and for the hydration shell. The results point to the existence of a first hydration shell with an average density approximately 10% larger than that of the bulk solvent in the conditions studied. Comparisons with the results of other studies suggest that this may be a general property of aqueous interfaces.
Figures

References
-
- Israelachvili J, Wennerström H. Nature (London) 1996;379:219–225. - PubMed
-
- Lehmann M S, Stansfield R. Biochemistry. 1989;28:7028–7033. - PubMed
-
- Savage H, Wlodawer A. Methods Enzymol. 1986;127:162–183. - PubMed
-
- Eisenberg H. Q Rev Biophys. 1981;14:141–172. - PubMed
-
- Bonneté F, Ebel C, Zaccai G, Eisenberg H. J Chem Soc Faraday Trans. 1993;89:2659–2666.
Publication types
MeSH terms
Substances
LinkOut - more resources
Full Text Sources
Other Literature Sources
