. 1998 Mar 3;95(5):2680-5.
doi: 10.1073/pnas.95.5.2680.

Fatty acids suppress voltage-gated Na+ currents in HEK293t cells transfected with the alpha-subunit of the human cardiac Na+ channel

Affiliations

Fatty acids suppress voltage-gated Na+ currents in HEK293t cells transfected with the alpha-subunit of the human cardiac Na+ channel

Y F Xiao et al. Proc Natl Acad Sci U S A. .

Abstract

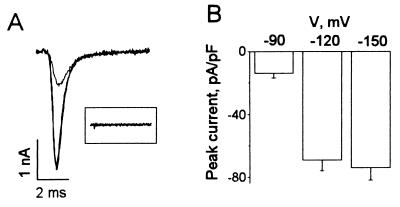
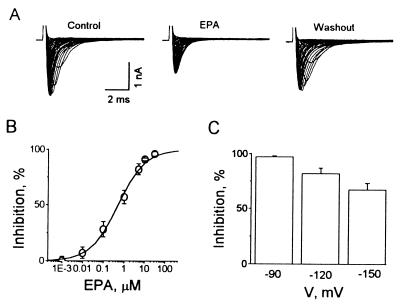
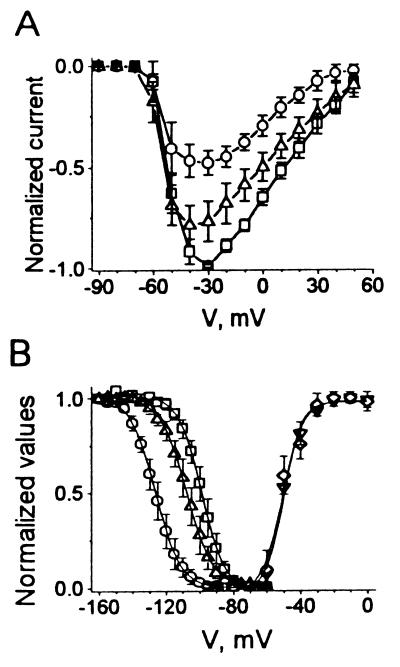
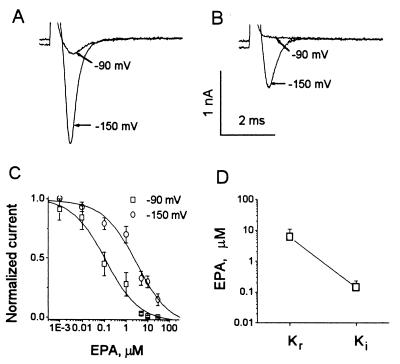
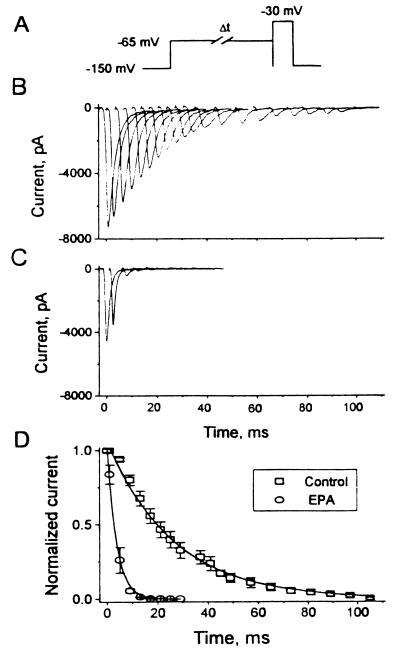
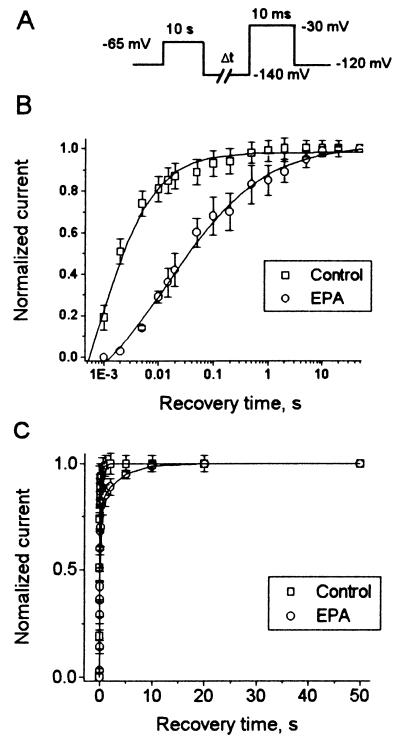
Studies have shown that fish oils, containing n-3 fatty acids, have protective effects against ischemia-induced, fatal cardiac arrhythmias in animals and perhaps in humans. In this study we used the whole-cell voltage-clamp technique to assess the effects of dietary, free long-chain fatty acids on the Na+ current (INa,alpha) in human embryonic kidney (HEK293t) cells transfected with the alpha-subunit of the human cardiac Na+ channel (hH1alpha). Extracellular application of 0.01 to 30 microM eicosapentaenoic acid (EPA, C20:5n-3) significantly reduced INa,alpha with an IC50 of 0.51 +/- 0.06 microM. The EPA-induced suppression of INa,alpha was concentration- and voltage-dependent. EPA at 5 microM significantly shifted the steady-state inactivation relationship by -27.8 +/- 1.2 mV (n = 6, P < 0.0001) at the V1/2 point. In addition, EPA blocked INa,alpha with a higher "binding affinity" to hH1alpha channels in the inactivated state than in the resting state. The transition from the resting state to the inactivated state was markedly accelerated in the presence of 5 microM EPA. The time for 50% recovery from the inactivation state was significantly slower in the presence of 5 microM EPA, from 2.1 +/- 0.8 ms for control to 34.8 +/- 2.1 ms (n = 5, P < 0.001). The effects of EPA on INa,alpha were reversible. Furthermore, docosahexaenoic acid (C22:6n-3), alpha-linolenic acid (C18:3n-3), conjugated linoleic acid (C18:2n-7), and oleic acid (C18:1n-9) at 5 microM and all-trans-retinoic acid at 10 microM had similar effects on INa,alpha as EPA. Even 5 microM of stearic acid (C18:0) or palmitic acid (C16:0) also significantly inhibited INa, alpha. In contrast, 5 microM EPA ethyl ester did not alter INa,alpha (8 +/- 4%, n = 8, P > 0.05). The present data demonstrate that free fatty acids suppress INa,alpha with high "binding affinity" to hH1alpha channels in the inactivated state and prolong the duration of recovery from inactivation.


Figures

Figure 1
Figure 1
The voltage-dependent Na+ currents in HEK293t cells transfected with hH1α, the α-subunit of the human cardiac Na+ channel. (A) Superimposed Na+ current traces were evoked by 10-ms duration depolarizing stimuli from −150, −120, and −90 mV to −30 mV at 0.2 Hz in an HEK cell expressing hH1α Na+ channels. The decrease of the maximal Na+ current from −120 compared with −150 mV is very small. The inset shows that no INa,α was evoked by the same voltage steps in a HEK293t cell not expressing hH1α Na+ channels. Capacitance and leakage currents have been subtracted on line from the Na+ currents shown. (B) The averaged peak INa,α was elicited by voltage steps to −30 mV from −150, −120, and −90 mV, respectively, in HEK293t cells expressing hH1α (n = 27).
Figure 2
Figure 2
Inhibitory effects of EPA on INa,α of hH1α channels expressed in HEK293t cells. (A) Whole-cell voltage-clamp traces from HEK293t cells expressing hH1α are superimposed. They were elicited by 10-ms test pulses from −90 mV to 55 mV with 5-mV increments at 0.2 Hz for control, 5 μM EPA and washout. The cell was held at −80 mV and hyperpolarized to −160 mV for 200 ms before a test pulse. (B) EPA suppressed INa,α is concentration-dependent with an IC50 of 0.51 ± 0.06 μM. INa,α was elicited by single voltage pulses from −120 to −30 mV. The sigmoidal curve is fit by y = {(A1A2)/[1 + (x/x0)p]}, origin 4.1, Microcal Software. Each value represents 6–12 individual preparations exposed to different concentrations of EPA. (C) Voltage-dependent suppression by EPA (5 μM) of INa,α in HEK293t cells expressing hH1α. The cells were held at −80 mV and hyperpolarized to −90, −120, and −150 mV for 200 ms before a test pulse to −30 mV.
Figure 3
Figure 3
The activation and deactivation of INa,α in hH1α expressed in HEK293t cells in the absence and presence of EPA (5 μM). (A) Averaged and normalized current-voltage relationships (n = 6) of INa,α were plotted in the absence (□), presence (○), and washout (▵) of 5 μM EPA. (B) The averaged relative activation of INa,α was determined by the ratio of conductances [G = I/(VVRev), in which VRev was the reversal potential from each I–V curve] to maximal conductance (Gmax). The curves were fit by a Boltzmann function: y = 1/{1 + exp[VV1/2)/k]}, which yields V1/2 of −50.1 ± 0.7 mV and a slope with k of 5.3 ± 0.7 mV in control (♦, n = 6). EPA (5 μM) did not significantly alter the activation with V1/2 of −50.8 ± 1.3 mV and a slope of k of 6.0 ± 1.1 mV (▿, n = 6, P > 0.05) − (Right). By contrast, EPA altered the steady-state inactivation of INa,α in HEK293t cells expressing hH1α (Left). Currents were evoked by two pulses at 0.1 Hz; a prepulse, 500-ms duration with 5-mV increments from −160 mV to −55 mV, and a test pulse of 10-ms duration from the various prepulses to −30 mV. The resting membrane potential was held at −80 mV. The normalized steady-state inactivation of peak INa,α shows the control (□) with fitting parameters (fit by a Boltzmann function: y = 1/{1 + exp[(VV1/2)/k]}) of V1/2 = −97.5 ± 2.3 mV and k = 6.8 ± 1.7, EPA (5 μM, ○) with fitting parameters of V1/2 = −125.3 ± 2.5 mV and k = 7.6 ± 1.5, and washout (▵) with fitting parameters of V1/2 = −105.8 ± 3.4 mV and k = 7.9 ± 1.8. The shift caused by EPA at V1/2 is significantly different from control (P < 0.0001 n = 6).
Figure 4
Figure 4
“Binding affinity” of EPA to hH1α channels in the resting and inactivated states. Current traces were evoked by voltage steps to −30 mV from the holding potentials of −90 mV or −150 mV in the absence (A) and presence (B) of 5 μM EPA. (C) The concentration-dependent suppression of resting (○) and inactivated (□) hH1 channels by EPA is shown. The data points are fit by the same equation as in Fig. 3B. Each value represents 6–12 cells (mean ± SEM). (D) Mean Kr and Ki of EPA in HEK293t cells expressing hH1α channels is shown. The concentration-dependent curves in C give a Kr from the −150 mV holding potential of 6.03 ± 4.78 μM when all of the hH1α channels are in the resting, activatable state. Ki is the equilibrium constant, 0.14 ± 0.09 μM of EPA, from the −90 mV holding potential when nearly all of the channels are in the inactive, closed state. Normalized current was calculated as INa,α(EPA)/INa,α(control) from the same cell.
Figure 5
Figure 5
Development of resting inactivation of INa,α in HEK293t cells expressing hH1α directly from the resting, activatable state. (A) The pulse protocol shows a depolarizing pulse from a holding potential of −150 mV to −65 mV. With progressively longer values of Δt at −65 mV an increasing proportion of hH1α transited directly to their inactivated state. This is followed by a 10-ms test pulse to −30 mV. Current traces of INa,α in the absence (B) and presence (C) of 5 μM EPA (n = 6). The membrane potential was held at −150 mV and cycling frequency was 0.2 Hz. (D) The effects of prolonging the time at −65 mV (during which increasing numbers of hH1α channels slipped directly from their resting state into their inactivated state) on the normalized currents in the presence and absence of EPA are shown. In the presence of EPA the time constant for the development of inactivation was significantly decreased [control 26.2 ± 0.78 ms, n = 6 and EPA (5 μM) 3.67 ± 0.22 ms, n = 6, P < 0.01)].
Figure 6
Figure 6
Kinetics of recovery of INa,α from inactivation. (A) Pulse protocol composed of a 10-s depolarizing pulse from −120 mV to −65 mV followed by a hyperpolarizing pulse to −140 mV of progressively longer durations and then a test pulse to −30 mV of 10-ms duration. The membrane holding potential was −120 mV and cycling frequency was 0.1 Hz. (B) The time course of recovery of peak INa,α in the absence (□, Control, n = 8) and presence (○, EPA, n = 5) of 5 μM EPA is shown. The test currents have been normalized to their maximal steady-state values of INa,α. Recovery of INa,α was markedly delayed; Δt1/2 in the presence of 5 μM EPA was 34.8 ± 2.1 ms compared with 2.1 ± 0.1 before EPA was present (n = 5, P < 0.001). Note a logarithmic scale of the abscissa. Data are fit by the same equation as in Fig. 3B. (C) The recovery times of INa,α were well fitted by a double exponential function.

References

    1. McLennan P L, Abeywardena M Y, Charnock J S. Can J Physiol Pharmacol. 1985;63:1411–1417. - PubMed
    1. McLennan P L, Bridle T M, Abeywardena M Y, Charnock J S. Am Heart J. 1992;123:1555–1561. - PubMed
    1. Hock C E, Beck L D, Bodine L C, Reibel D K. Am J Physiol. 1990;259:H1518–H1526. - PubMed
    1. Billman G E, Hallaq H, Leaf A. Proc Natl Acad Sci USA. 1994;91:4427–4430. - PMC - PubMed
    1. Burr M, Gilbert J F, Holliday R M, Elwood P C, Fehily A M, Rogers S, Sweetnam P M, Deadman N M. Lancet. 1989;334:757–761. - PubMed

Publication types

MeSH terms