. 1998 Mar 3;95(5):2697-702.
doi: 10.1073/pnas.95.5.2697.

Abscisic acid signal transduction in the barley aleurone is mediated by phospholipase D activity

Affiliations

Abscisic acid signal transduction in the barley aleurone is mediated by phospholipase D activity

S Ritchie et al. Proc Natl Acad Sci U S A. .

Abstract

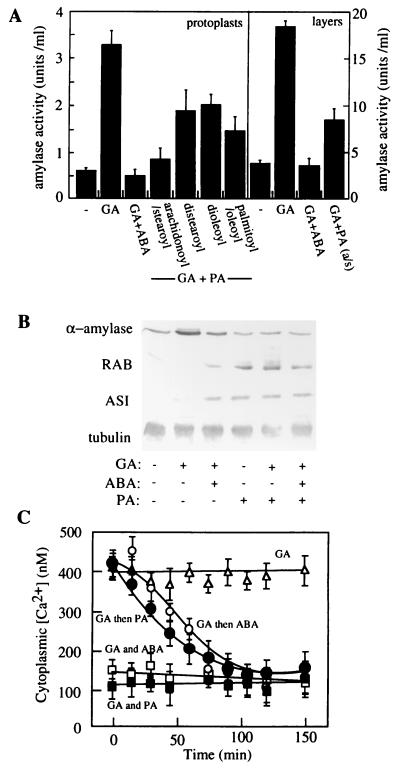
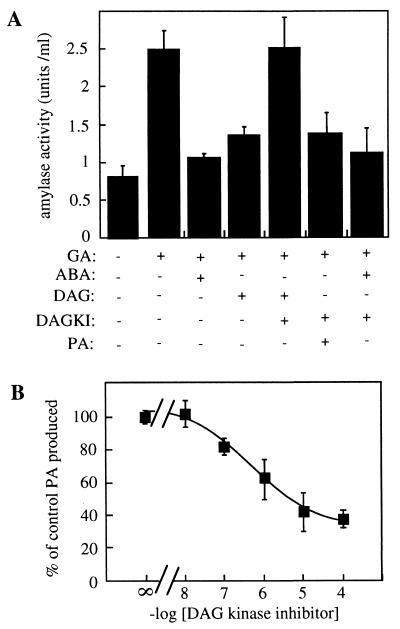
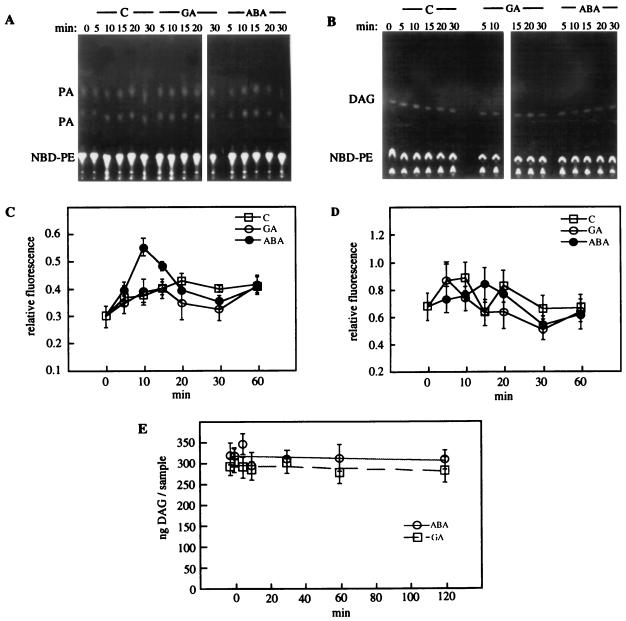
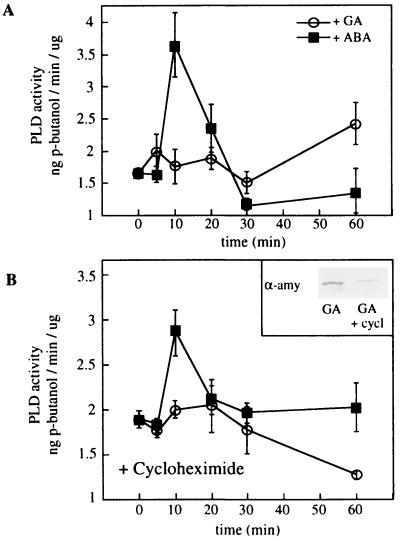
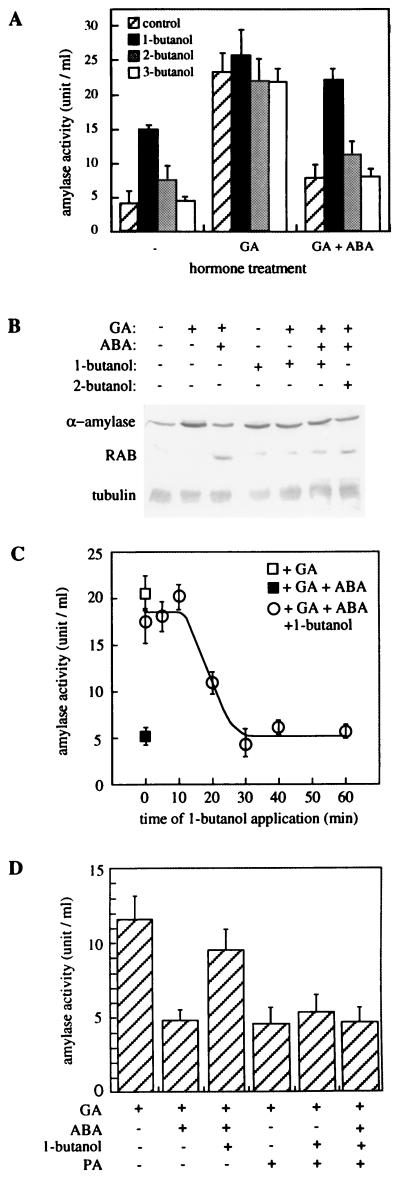
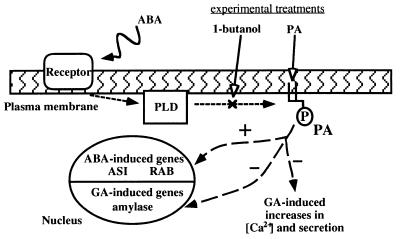
The plant hormones abscisic acid (ABA) and gibberellic acid (GA) are important regulators of the dormancy and germination of seeds. In cereals, GA enhances the synthesis and secretion of enzymes (principally alpha-amylases) in the aleurone cells of the endosperm, which then mobilize the storage reserves that fuel germination. ABA inhibits this enhanced secretory activity and delays germination. Despite the central role of ABA in regulating germination, the signal transduction events leading to altered gene expression and cellular activity are essentially unknown. We report that the application of ABA to aleurone protoplasts increased the activity of the enzyme phospholipase D (PLD) 10 min after treatment. The product of PLD activity, phosphatidic acid (PPA), also increased transiently at this time. The application of PPA to aleurone protoplasts led to an ABA-like inhibition of alpha-amylase production, and induction of the ABA up-regulated proteins ASI (amylase subtilisin inhibitor) and RAB (responsive to ABA). Inhibition of PLD activity by 0.1% 1-butanol during the initial 20 min of ABA treatment resulted in inhibition of ABA-regulated processes. This inhibition coincided with the timing of PLD activation by ABA and was overcome by simultaneous addition of PPA. These results suggest that ABA activates the enzyme PLD to produce PPA that is involved in triggering the subsequent ABA responses of the aleurone cell.


Figures

Figure 1
Figure 1
The effects of PPA on aleurone protoplasts and layers. (A) Freshly isolated protoplasts and layers were treated with GA (5 μM), ABA (5 μM), or PPA (50 μM) and secreted α-amylase activity assayed after 48 hr. For protoplasts four types of PPA were used, differing in their acyl chains as denoted, for layers PPA with the acyl chain arachidonoyl/stearoyl was used. The data shows mean ± SEM, n = 3. (B) Western blot analyses show the effect of arachidonoyl/stearoyl PPA on levels of α-amylase, tubulin, and the ABA-induced proteins RAB and ASI. These blots reflect the levels of the proteins in the protoplasts rather than secreted activity assayed in A. Protoplasts were treated for 48 hr, protein extracted, and SDS/PAGE and immunoblotting carried out as described in Materials and Methods. (C) Effect of arachidonoyl/stearoyl PPA on cytoplasmic [Ca2+] levels. Protoplasts were treated with either GA for 24 hr and then with PPA (GA then PPA) or ABA (GA then ABA), or freshly isolated protoplasts were treated simultaneously with GA and PPA or GA and ABA.
Figure 2
Figure 2
The effect of DAG and DAG kinase inhibitor (DAGKI) on aleurone protoplasts. (A) Freshly isolated protoplasts were treated with GA (5 μM), ABA (5 μM), DAG (1,2-dioctanoyl-sn-glycerol; 50 μM), and DAG kinase inhibitor (R59949; 10 μM). After 48 hr, secreted α-amylase activity was assayed. (B) The effect of DAG kinase inhibitor on aleurone DAG kinase. Protein was extracted and DAG kinase activity assayed in the presence a range of DAGKI concentrations as described in Materials and Methods. Data represent mean ± SEM, n = 3.
Figure 3
Figure 3
Changes in levels of PPA and DAG in response to GA and ABA. (A and B) Fluorescence image of TLC plates separating PPA (A), or DAG (B), extracted from protoplasts treated with or without GA (5 μM) or ABA (5 μM) for the indicated times (C, control, no hormone). The protoplasts were loaded with NBD-PE as described in Materials and Methods. (C and D) Quantification of PPA and DAG levels from TLC plates shown in A and B, the data shows the mean ± SEM, n = 3 separate experiments. (E) Total protoplast DAG assayed by using the Amersham DAG assay kit. Samples were taken at the indicated times after GA or ABA treatment. Data represent mean ± SEM, n = 3.
Figure 4
Figure 4
PLD activity in aleurone protoplasts treated with GA or ABA. (A) GA (5 μM) or ABA (5 μM) was applied to protoplasts for various times and PLD activity assayed in vitro as described in Materials and Methods. (B) Protoplasts were incubated in 5 μg/ml cycloheximide for 2 hr and then treated with ABA or GA, and PLD assayed as for A. Mean ± SEM, n = 3 separate experiments. (B Inset) Protoplasts were treated with 5 μM GA, with (+cycl) or without cycloheximide (5 μg/ml) for 48 hr. Protein was extracted, and SDS/PAGE and immunoblotting carried out as described in Materials and Methods.
Figure 5
Figure 5
The effect of butanol on amylase activity and protein levels of aleurone cells. (A) Aleurone tissue was treated with GA (5 μM), ABA (5 μM), 0.1% 1,2, or 3 -butanol as denoted. α-Amylase secretion was then assessed after 48 hr. Results represent mean ± SEM, n = 4. (B) Aleurone tissue was treated as in A, and the levels of α-amylase, tubulin and the ABA-induced protein RAB assessed by western blotting. These immunoblots indicate the levels of proteins extracted from the protoplasts rather than the secreted activity assayed in A. (C) Aleurone tissue was treated with 5 μM GA for 4 hr, then with 5 μM ABA, then with 0.1% 1-butanol at various times after the ABA. α-Amylase activity was assayed after 48 hr treatment. Results represent mean ± SEM, n = 4. (D) Aleurone tissue was treated with GA (5 μM), ABA (5 μM), 0.1% 1-butanol, and 50 μM PPA (acyl chains arachidonoyl/stearoyl) as noted and α-amylase secretion assessed after 48 hr. The data represent mean ± SEM, n = 3.
Figure 6
Figure 6
A schematic diagram of the involvement of PLD and PPA in the ABA signal transduction process in the barley aleurone. Solid-headed arrows represent events proposed to occur during the response of the aleurone to ABA, open-headed arrows represent manipulations to the system carried out in experiments described in this work.

Similar articles

Cited by

References

    1. Hong B, Barg B, Ho T-h D. Plant Mol Biol. 1992;18:663–674. - PubMed
    1. Mundy J, Chua N-H. EMBO J. 1988;7:2279–2286. - PMC - PubMed
    1. van der Veen R, Heimovaara-Dijkstra S, Wang M. Plant Physiol. 1992;100:699–705. - PMC - PubMed
    1. Heimovaara-Dijkstra S, Heistek J C, Wang M. Plant Physiol. 1994a;106:359–750. - PMC - PubMed
    1. Heimovaara-Dijkstra S, Vanduijn B, Libbenga K R, Heidekamp F, Wang M. Plant Cell Physiol. 1994b;35:743–750.

Publication types

MeSH terms

LinkOut - more resources