. 1998 Feb;116(2):755-64.
doi: 10.1104/pp.116.2.755.

Photosystem I is an early target of photoinhibition in barley illuminated at chilling temperatures

Affiliations

Photosystem I is an early target of photoinhibition in barley illuminated at chilling temperatures

S E Tjus et al. Plant Physiol. 1998 Feb.

Abstract

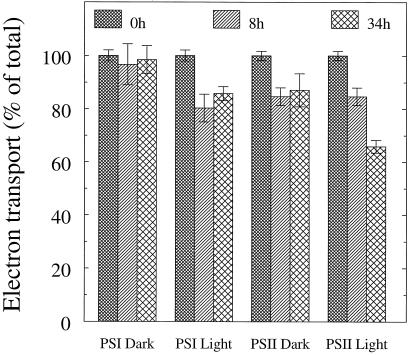
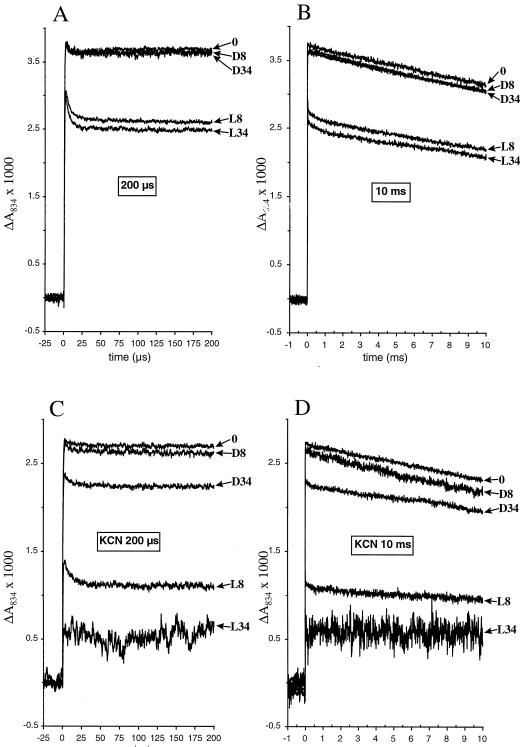
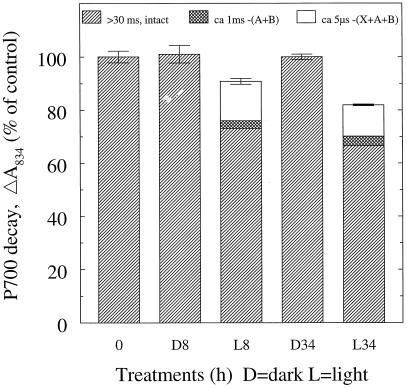
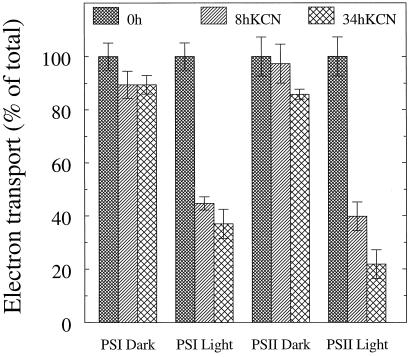
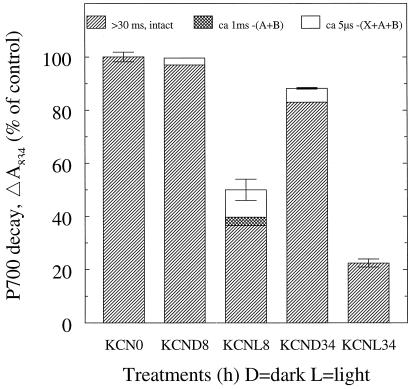
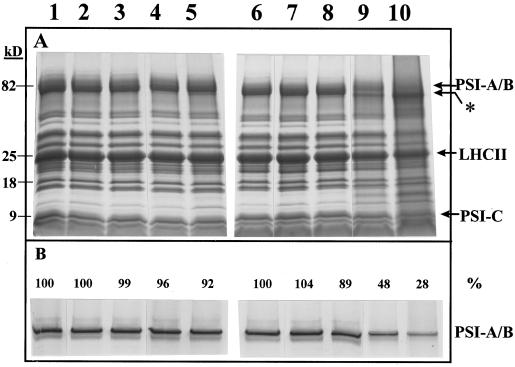
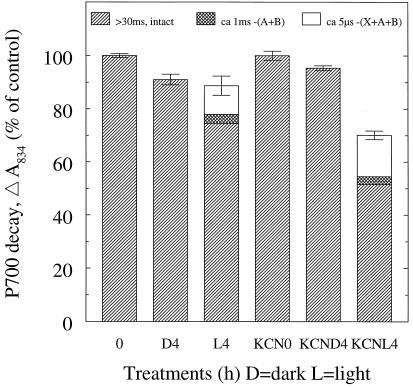
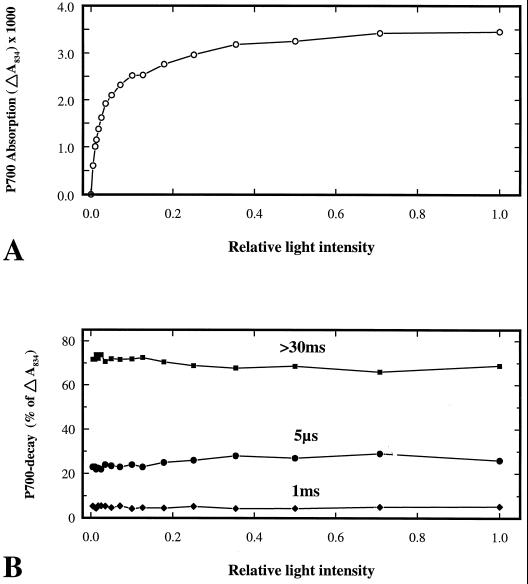
Light-induced damage to photosystem I (PSI) was studied during low-light illumination of barley (Hordeum vulgare L.) at chilling temperatures. A 4-h illumination period induced a significant inactivation of PSI electron transport activity. Flash-induced P700 absorption decay measurements revealed progressive damage to (a) the iron-sulfur clusters FA and FB, (b) the iron-sulfur clusters FA, FB, and FX, and (c) the phylloquinone A1 and the chlorophyll AO or P700 of the PSI electron acceptor chain. Light-induced PSI damage was also evidenced by partial degradation of the PSI-A and PSI-B proteins and was correlated with the appearance of smaller proteins. Aggravated photodamage was observed upon illumination of barley leaves infiltrated with KCN, which inhibits Cu,Zn-superoxide dismutase and ascorbate peroxidase. This indicates that the photodamage of PSI in barley observed during low-light illumination at chilling temperatures arises because the defense against active oxygen species by active oxygen-scavenging enzymes is insufficient at these specific conditions. The data obtained demonstrate that photoinhibition of PSI at chilling temperatures is an important phenomenon in a cold-tolerant plant species.


Figures

Figure 1
Figure 1
Electron transport in thylakoid membranes isolated from barley leaves subjected to illumination (100 μmol photons m−2 s−1) at 4°C for 8 or 34 h. Electron transport rates were assayed using an oxygen electrode. Error bars indicate sds (n = 2–3). The 100% activity was −229 and 178 μmol O2 (mg chlorophyll)−1 h−1 for PSI and PSII, respectively.
Figure 2
Figure 2
Flash-induced absorption change of P700 in isolated thylakoid membranes. A and B represent 200-μs and 10-ms time windows, respectively, of an illumination experiment carried out as described in Figure 1. C and D represent 200-μs and 10-ms time windows, respectively, of an illumination experiment carried out as described in Figure 4 using leaves infiltrated with 10 mm KCN. Arrows refer to different treatments in hours. D, Dark-treated; L, light-treated.
Figure 3
Figure 3
Resolution of flash-induced absorption changes of P700 into decay components with different time constants. The data shown in Figure 2, A and B, are a subset of the data used to produce this figure. A, B, and X refer to the Fe-S clusters FA, FB and FX, respectively. The >30-ms time component represents an intact PSI reaction center with recombination from (FA/FB). The 1-ms time component reflects recombination from FX after loss of FA/FB activity. The 5-μs time component represents recombination from either A1 or A0 when FA/FB and FX are all inactivated. Error bars indicate sds for the total absorption amplitudes (n = 2–8).
Figure 4
Figure 4
Electron transport in thylakoid membranes isolated from barley leaves infiltrated with 10 mm KCN and subjected to illumination (100 μmol photons m−2 s−1) at 4°C for 8 and 34 h. Electron transport rates were assayed using an oxygen electrode. Error bars indicate sds (n = 2–3). The 100% activity was −234 and 163 μmol O2 (mg chlorophyll)−1 h−1 for PSI and PSII, respectively.
Figure 5
Figure 5
Resolution of flash-induced absorption changes of P700 into decay components with different time constants. The data shown in Figure 2, C and D, are a subset of the data used to produce this figure. Error bars indicate sds for the total absorption amplitudes (n = 2–7). For further explanation, see legend to Figure 3.
Figure 6
Figure 6
A, SDS-PAGE of thylakoid membranes isolated after illumination of barley leaves with or without KCN, as specified in Figures 1 and 4. Each sample corresponds to 8 μg of chlorophyll. Lane 1, 0 h; lane 2, 8 h of dark; lane 3, 34 h of dark; lane 4, 8 h of illumination; lane 5, 34 h of illumination; lane 6, KCN plus 0 h; lane 7, KCN plus 8 h dark; lane 8, KCN plus 34 h of dark; lane 9, KCN plus 8 h of illumination; and lane 10, KCN plus 34 h of illumination. B, Immunoblot of the same samples in A, each corresponding to 0.5 μg of chlorophyll, using an antibody directed against the PSI complex. The blot was densitometrically scanned and the relative intensities of coloring are specified above the separate lanes.
Figure 7
Figure 7
Flash-induced absorption changes of P700 in thylakoid membranes isolated from barley leaves infiltrated with 4 mm KCN and subjected to illumination (100 μmol photons m−2 s−1) at 4°C for 4 h. ΔA834 was resolved into decay components with different time constants. Error bars indicate sds for the total absorption amplitudes (n = 4–8). For further explanation, see legend to Figure 3.
Figure 8
Figure 8
Light-saturation analysis of P700 decay components. Isolated thylakoid membranes from 4 mm KCN-infiltrated leaves illuminated for 4 h, as specified in Figure 7, were subjected to analysis of P700 absorption changes at different excitation light intensities from 0 to the saturation level. A, Total signal amplitude. B, The amplitude resolved into relative contribution of three charge recombination components of >30 ms, 1 ms, and 5 μs. For an explanation of the charge recombination times, see legend to Figure 3.

Similar articles

Cited by

References

    1. Anderson JM, Andersson B. The dynamic photosynthetic membrane and regulation of solar energy conversion. Trends Biochem Sci. 1988;13:351–355. - PubMed
    1. Andersson B, Styring S. Photosystem II: molecular organisation, function, and acclimation. Curr Top Bioenerg. 1991;16:1–81.
    1. Arnon DI. Copper enzymes in isolated chloroplasts. Polyphenoloxidase in Beta vulgaris. Plant Physiol. 1949;24:1–14. - PMC - PubMed
    1. Aro EM, Hundal T, Carlberg I, Andersson B. In vitro studies on light-induced inhibition of photosystem II and D1-protein degradation at low temperatures. Biochim Biophys Acta. 1990;1019:269–275.
    1. Aro E-M, Virgin I, Andersson B. Photoinhibition of photosystem II. Inactivation, protein damage and turnover. Biochim Biophys Acta. 1993;1143:113–134. - PubMed

Publication types

MeSH terms

Substances

LinkOut - more resources