. 1998 Mar 9;140(5):975-89.
doi: 10.1083/jcb.140.5.975.

Interphase cell cycle dynamics of a late-replicating, heterochromatic homogeneously staining region: precise choreography of condensation/decondensation and nuclear positioning

Affiliations

Interphase cell cycle dynamics of a late-replicating, heterochromatic homogeneously staining region: precise choreography of condensation/decondensation and nuclear positioning

G Li et al. J Cell Biol. .

Abstract

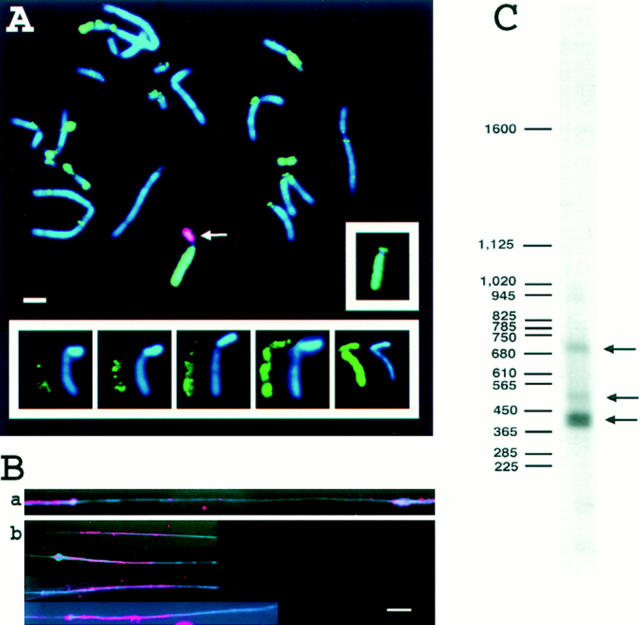
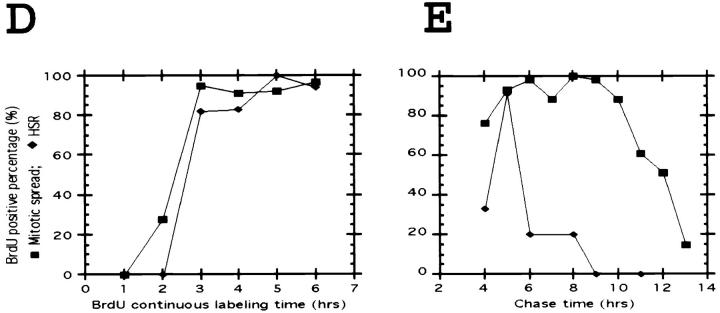
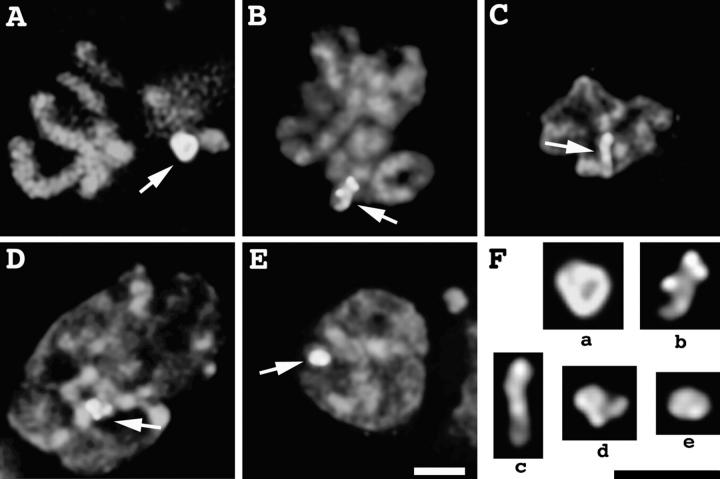
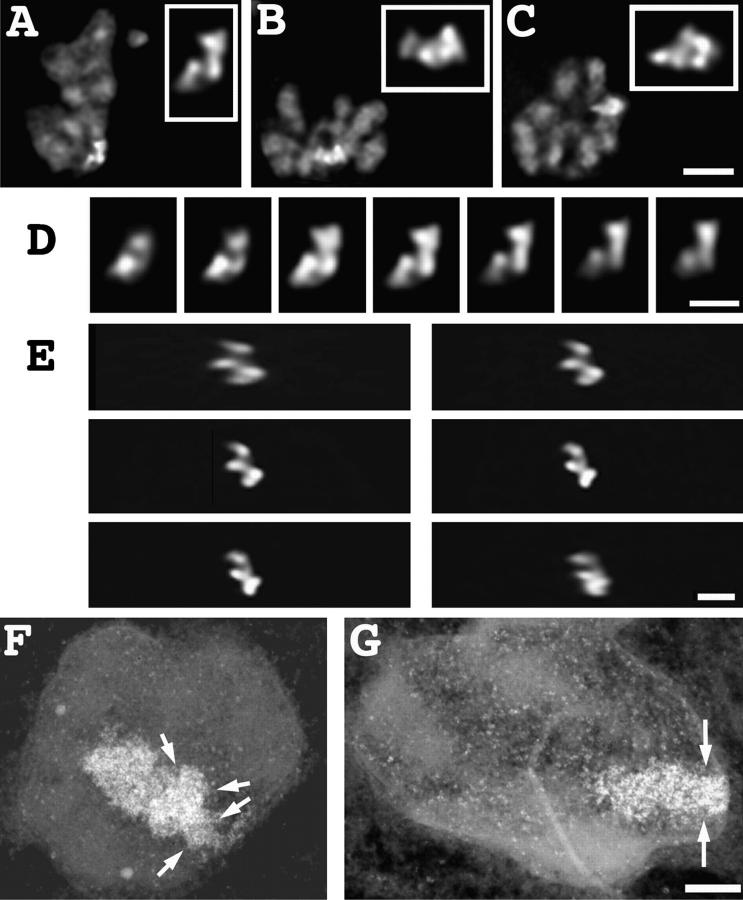
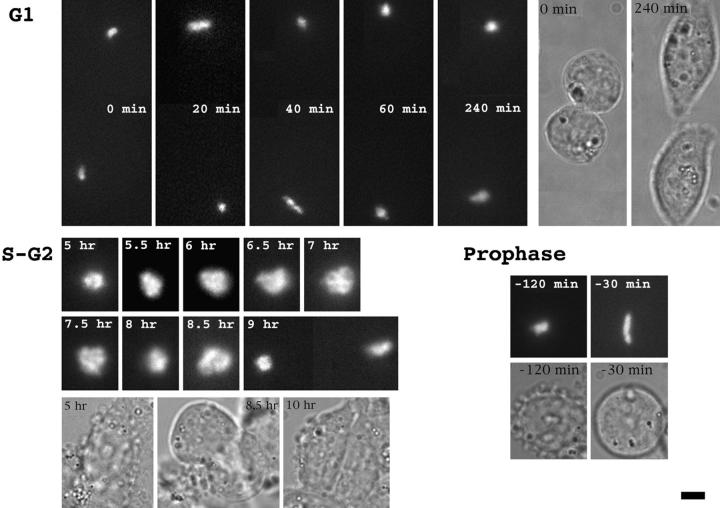
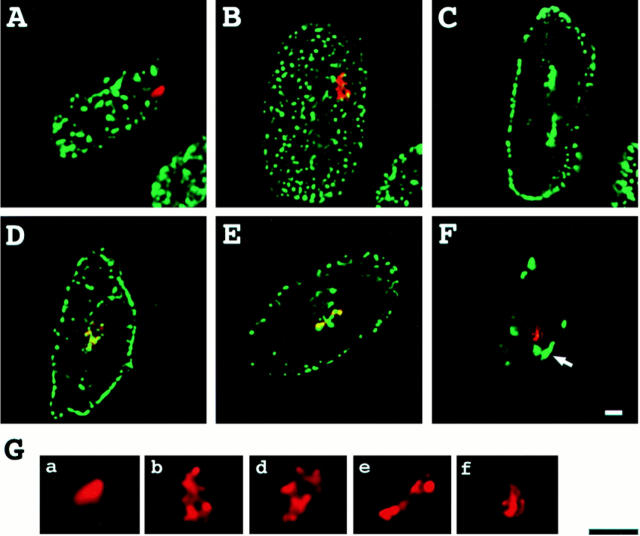
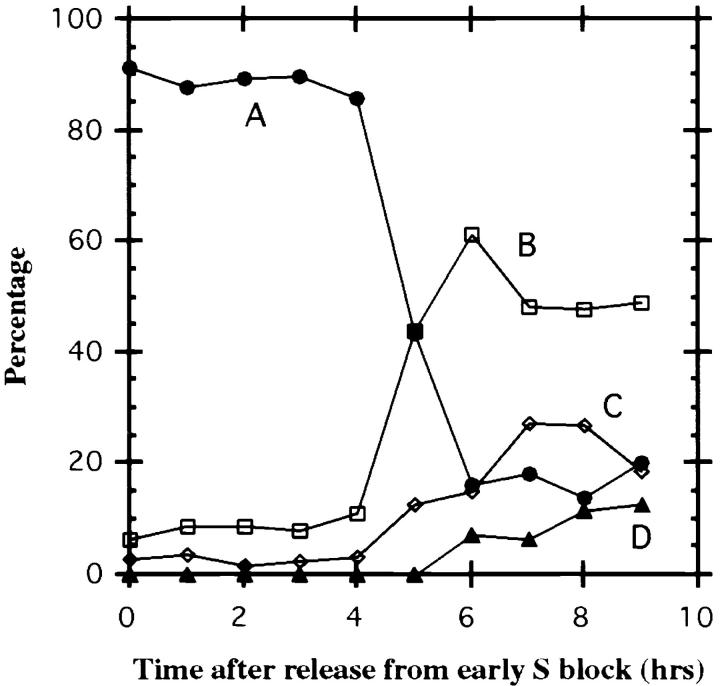
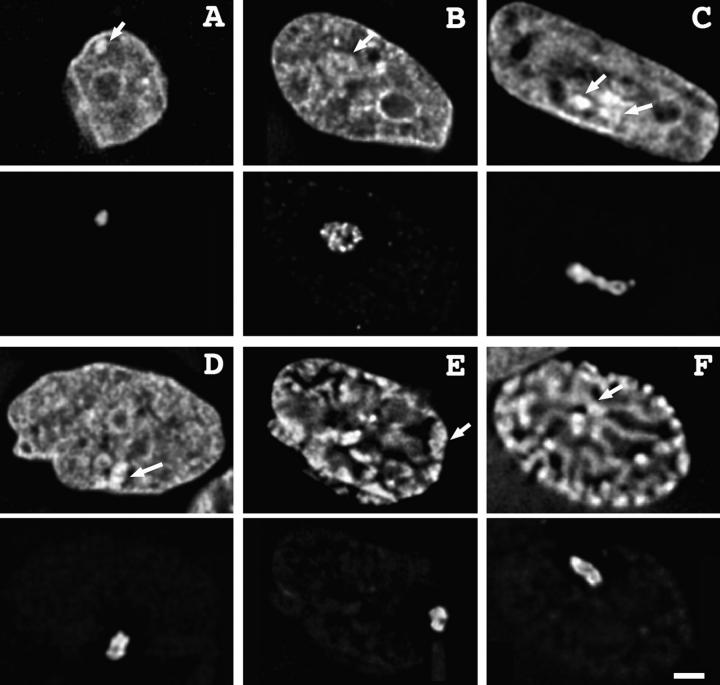
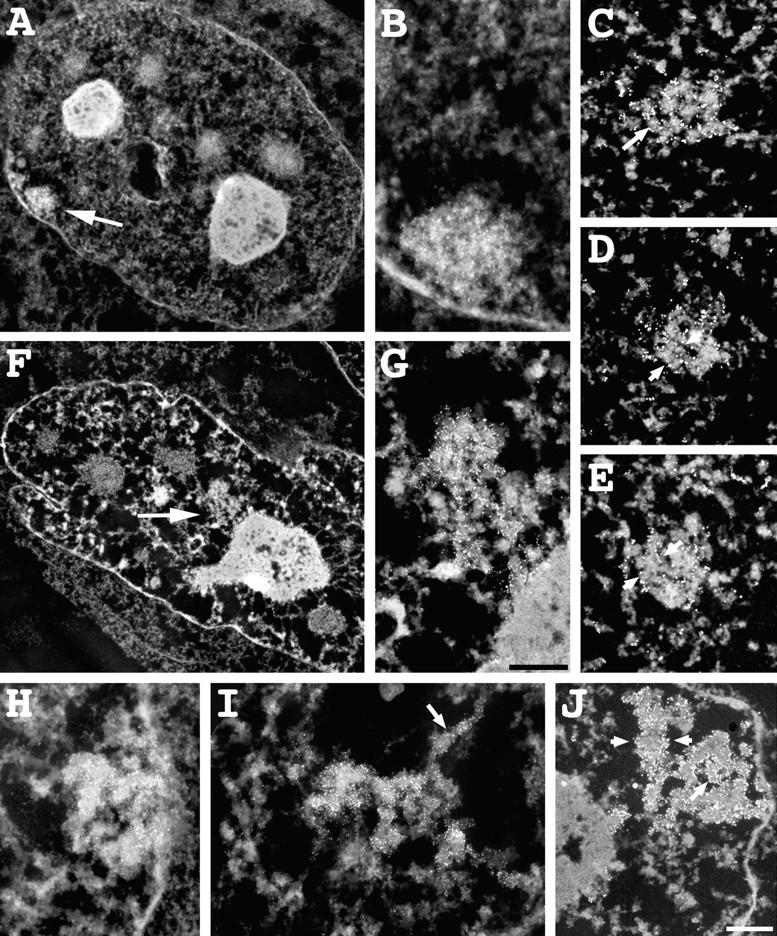
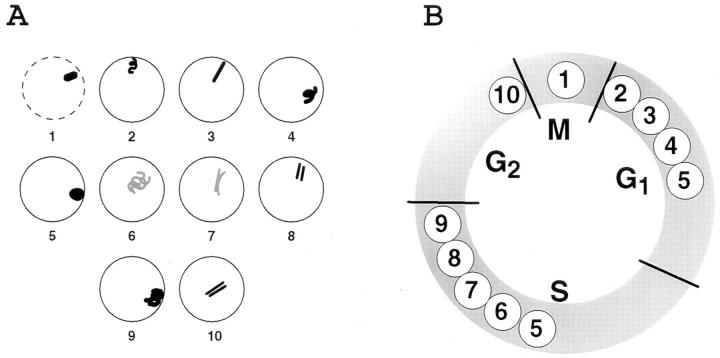
Recently we described a new method for in situ localization of specific DNA sequences, based on lac operator/repressor recognition (Robinett, C.C., A. Straight, G. Li, C. Willhelm, G. Sudlow, A. Murray, and A.S. Belmont. 1996. J. Cell Biol. 135:1685-1700). We have applied this methodology to visualize the cell cycle dynamics of an approximately 90 Mbp, late-replicating, heterochromatic homogeneously staining region (HSR) in CHO cells, combining immunostaining with direct in vivo observations. Between anaphase and early G1, the HSR extends approximately twofold to a linear, approximately 0.3-mum-diam chromatid, and then recondenses to a compact mass adjacent to the nuclear envelope. No further changes in HSR conformation or position are seen through mid-S phase. However, HSR DNA replication is preceded by a decondensation and movement of the HSR into the nuclear interior 4-6 h into S phase. During DNA replication the HSR resolves into linear chromatids and then recondenses into a compact mass; this is followed by a third extension of the HSR during G2/ prophase. Surprisingly, compaction of the HSR is extremely high at all stages of interphase. Preliminary ultrastructural analysis of the HSR suggests at least three levels of large-scale chromatin organization above the 30-nm fiber.


Figures

Figure 1
Figure 1
A03_1 HSR characterization: (A) HSR (arrow) is on a distinctive, late-replicating chromosome, present in the parental DG44 cell line (top inset) and is itself late replicating. Log phase cells were labeled continuously for 2–3 h with BrdU and mitotic spreads prepared and triple stained with anti-BrdU (green), anti– lac repressor (red), and DAPI (blue). Lower inset shows selected examples from 2 h (first two panels) or 3 h (last three panels) BrdU labeling. HSR replication finishes before the adjacent arm completes replication. (B) Organization of vector repeats visualized within stretched A03_1 DNA, stained with DAPI (blue) and lac repressor (red). (a) Example of flanking DNA between lac repressor staining regions. (b) Several examples of lac repressor– staining regions. (C) Southern blot shows size of vector repeat. A03_1 genomic DNA was digested with Bsu36I, which does not cut the pSV2–DHFR–8.32 vector. The major band (a doublet) is at ∼400 kb with minor bands at 500 and 700 kb. (D) HSR finishes replication 0.5–1 h before the end of S phase. Percentage of mitotic spreads or HSRs incorporating BrdU versus time of BrdU continuous labeling. (E) HSR replication peaks at ∼6 h after beginning of S phase (∼11 h chase time). Percentage of mitotic spreads or HSR incorporating BrdU versus chase time after 15 min BrdU pulse labeling. (D and E) Squares correspond to labeling of mitotic spreads, and diamonds to labeling of HSR (at least 100 cells per data point). Bars: (A) 2 μm; (B) 20 μm.
Figure 1
Figure 1
A03_1 HSR characterization: (A) HSR (arrow) is on a distinctive, late-replicating chromosome, present in the parental DG44 cell line (top inset) and is itself late replicating. Log phase cells were labeled continuously for 2–3 h with BrdU and mitotic spreads prepared and triple stained with anti-BrdU (green), anti– lac repressor (red), and DAPI (blue). Lower inset shows selected examples from 2 h (first two panels) or 3 h (last three panels) BrdU labeling. HSR replication finishes before the adjacent arm completes replication. (B) Organization of vector repeats visualized within stretched A03_1 DNA, stained with DAPI (blue) and lac repressor (red). (a) Example of flanking DNA between lac repressor staining regions. (b) Several examples of lac repressor– staining regions. (C) Southern blot shows size of vector repeat. A03_1 genomic DNA was digested with Bsu36I, which does not cut the pSV2–DHFR–8.32 vector. The major band (a doublet) is at ∼400 kb with minor bands at 500 and 700 kb. (D) HSR finishes replication 0.5–1 h before the end of S phase. Percentage of mitotic spreads or HSRs incorporating BrdU versus time of BrdU continuous labeling. (E) HSR replication peaks at ∼6 h after beginning of S phase (∼11 h chase time). Percentage of mitotic spreads or HSR incorporating BrdU versus chase time after 15 min BrdU pulse labeling. (D and E) Squares correspond to labeling of mitotic spreads, and diamonds to labeling of HSR (at least 100 cells per data point). Bars: (A) 2 μm; (B) 20 μm.
Figure 2
Figure 2
HSR changes during telophase/early G1. A03_1 cells were stained with lac repressor different times after release from mitotic block (t = 0). Deconvolved lac repressor (Texas red) and DNA (DAPI) staining images are superimposed in A–E; bright regions (arrows) correspond to lac staining. (A) Metaphase HSR, ∼1 μm in length. Staining is concentrated on periphery. (B) Initial uncoiling of HSR (40 min). (C) Extension of HSR to ∼0.3-μm diam, ∼2-μm-long fiber (80 min). (D) Intermediate, possibly irregularly coiled (see text) structure leading towards condensed chromatin mass (180 min). (E) Uniform, condensed mass with no substructure evident at light microscopy resolution (4 h). (F) HSRs in A–E at higher magnification. Bars, 2 μm.
Figure 3
Figure 3
Chromosome uncoiling during telophase/early G1. A03_1 cells were stained with lac repressor 40 min after release from nocodazole. (A–C) Deconvolved optical sectioning data from selected examples. HSR staining is merged with DAPI staining as in Fig. 2. (D) Serial optical sections, separated by 0.2 μm, showing uncoiling of HSR (same HSR as A). (E) Stereo pairs from projection of three-dimensional data set (same HSR as in Fig. 2 B): top, −32°, and −18°; middle, −10°, and 4°; and bottom, 8°, and 22°. (F–G) Immunogold EM of synchronized cells, 0.2-μm-thick sections. (F) Condensed telophase HSR before uncoiling (image suggests coiling with arrows bracketing ∼0.3-μm apparent fibers or striations). (G) Extended ∼0.3-μm-wide fiber. Bars: (A–C) 2 μm; (D and E) 1 μm; (F and G) 0.5 μm.
Figure 7
Figure 7
In vivo dynamics of A03_1 HSR. Top left, linear extension of HSR is followed by condensation in early G1 nuclei. Two daughter cells in late telophase—20 or 40 min after beginning observation, HSR linearizes in each daughter cell. Recondensation occurs within 20 min and HSR remains condensed for several hours afterwards. Top right, corresponding transmitted light images at 0 and 240 min. Bottom left, Progression of HSR from late S through mitosis, with t = 0 corresponding to release from early S phase block. HSR decondensation of HSR begins at 5 h, with “C” shaped appearance, followed by transition to larger, ball-shaped HSR with internal fibrillar structure (7 h). Suggestion of possible linear stage at 7.5 h is followed by a compaction at 8 h and a regaining of a linear, curled conformation at 8.5 h with chromosome segregation at 9 h. (Transmitted light pictures shown below.) Bottom right, transition of compact HSR in late S or G2 to linear, extended chromosome axis in prophase. −120 and −30 refer to minutes before cell division. Fluorescent (top) and transmitted images (bottom). Bars: (fluorescence) 2 μm; (transmitted) 4 μm.
Figure 6
Figure 6
HSR replication correlates with changes in HSR conformation and intranuclear positioning. (A–F) Merged lac repressor (red) and BrdU pulse label (green) images. (A) Grazing optical section shows early S phase DNA replication pattern 2 with peripheral, condensed, and unlabeled HSR; (B–E) middle S phase DNA replication pattern 3 with small peripheral BrdU incorporation sites. Grazing (B) and mid-nuclear (C) sections of same nucleus. Peripheral HSR has decondensed into ball-shaped, open conformation, but has not yet begun DNA replication. (D) Different nucleus, HSR is similarly decondensed but now shows extensive repressor and BrdU colocalization and is located within nuclear interior. (E) Linear HSR conformation with interior location, at this conformational stage all HSRs show BrdU colocalization. (F) Very late S DNA replication pattern 5, with HSR now in “open-2” conformation (see text); HSR has completed replication and is adjacent to large replication focus with partial association (arrow) to nuclear periphery; this is most likely the late-replicating chromosome arm opposite the HSR. (G) Enlarged HSR images, A–F. Bars: (A–F) 1 μm; (G) 2 μm.
Figure 5
Figure 5
Percentage of different HSR conformations in late S phase and G2 nuclei at different times after release from early S phase block. HSR remains condensed (pattern A) first 4 h, then decondenses between 4 and 6 h after release. Patterns are defined as (see also Fig. 4): (A) condensed, compact HSR <1-μm diam; (B) larger, decondensed, ball-shaped HSR with internal fibrillar structure and 1.5–3-μm in diam; (C) extended, linear HSR, 3–4 μm in length, with appearance of intertwined fibers in some regions; and (D) HSR with two obvious parallel fibers, 1–3 μm in length. Data points represent statistics from >100 nuclei.
Figure 4
Figure 4
A03_1 HSR changes during S through G2. Cells were stained with lac repressor at various times after release from early S phase block. Top rows, DAPI; bottom rows, lac repressor staining (top and bottom panels are aligned precisely). Arrows in DAPI images point to HSR location. (A) 0 h, pattern A: compact, featureless, HSR near NE; (B) 6 h, pattern B: decondensed, ball-shaped HSR with internal fibrillar appearance; (C) 6 h, pattern C: linear HSR suggestive of intertwined chromatids; (D) 9 h, pattern D: linear HSR with parallel chromatids; (E) 9 h, showing larger condensed mass in late G2/early prophase nucleus; and (F) 9 h, prophase HSR with extended, parallel chromatids. Bar, 2 μm.
Figure 8
Figure 8
Changes in HSR ultrastructure during S–G2 progression. (A and B) Condensed, peripherally located HSR (arrow), 0 h after release from early S phase block. (Section thickness 0.5 μm). HSR is condensed and adjacent to nuclear envelope. (C–E) 60-nm-thick serial sections of early S phase HSR. Several levels of chromatin condensation are suggested. Immunogold staining is confined to exterior HSR surfaces. Small arrow points to ∼100-nm fibers, compacted within HSR, similar to chromonema fibers seen throughout nucleus. Arrowheads bracket larger, ∼200-nm-diam features. Several serial section data sets to date consistently show apparent 200-nm fibers at this 0 h stage. (F and G) Decondensed, ball-shaped HSR, 6 h after release from early S phase. HSR (arrow) is adjacent to nucleolus with regions closely apposed to nucleolar surface. (H–J) Different examples of HSR conformation, 6 h after release from early S phase. (H) 0.5-μm section with HSR adjacent to nuclear envelope suggestive of a 0.3–0.4-μm chromatid curled into “C” shape. (I) decondensed HSR with extended chromonema fiber (arrow) (0.2-μm section). (J) Linear HSR (60-nm section). Arrowheads bracket an ∼0.2–0.25-μm-diam segment, bottom right suggests parallel chromatids, with arrowhead pointing to chromonema fiber outlined by peripheral gold staining. Bars: (A–J) 0.5 μm.
Figure 9
Figure 9
Summary of changes in A03_1 HSR conformation and intranuclear position as a function of cell cycle progression. (A) shows a sequence of different conformations and intranuclear positions seen for the HSR during interphase; gray color of HSR denotes DNA replication; (B) the approximate cell cycle timing for each of the stages in this sequence.

References

    1. Becker, W.M., J.B. Reece, and M.F. Poenie. 1996. The World of the Cell. The Benjamin/Cummings Publishing Co., Menlo Park. 434–435.
    1. Belmont, A.S. 1997. Large–scale chromatin organization. In Genome Structure and Function. Kluwer Academic Publishers, Dordrecht, Germany. 261–276.
    1. Belmont AS, Bruce K. Visualization of G1 chromosomes—a folded, twisted, supercoiled chromonema model of interphase chromatid structure. J Cell Biol. 1994;127:287–302. - PMC - PubMed
    1. Belmont AS, Sedat JW, Agard DA. A three-dimensional approach to mitotic chromosome structure: evidence for a complex hierarchical organization. J Cell Biol. 1987;105:77–92. - PMC - PubMed
    1. Belmont AS, Braunfeld MB, Sedat JW, Agard DA. Large-scale chromatin structural domains within mitotic and interphase chromosomes in vivo and in vitro. Chromosoma. 1989;98:129–143. - PubMed

Publication types

Substances