. 1998 Mar 9;140(5):1091-9.
doi: 10.1083/jcb.140.5.1091.

Functional imaging of mitochondria in saponin-permeabilized mice muscle fibers

Affiliations

Functional imaging of mitochondria in saponin-permeabilized mice muscle fibers

A V Kuznetsov et al. J Cell Biol. .

Abstract

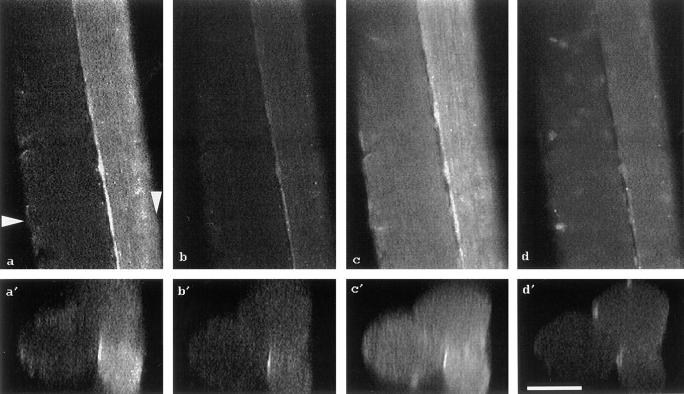
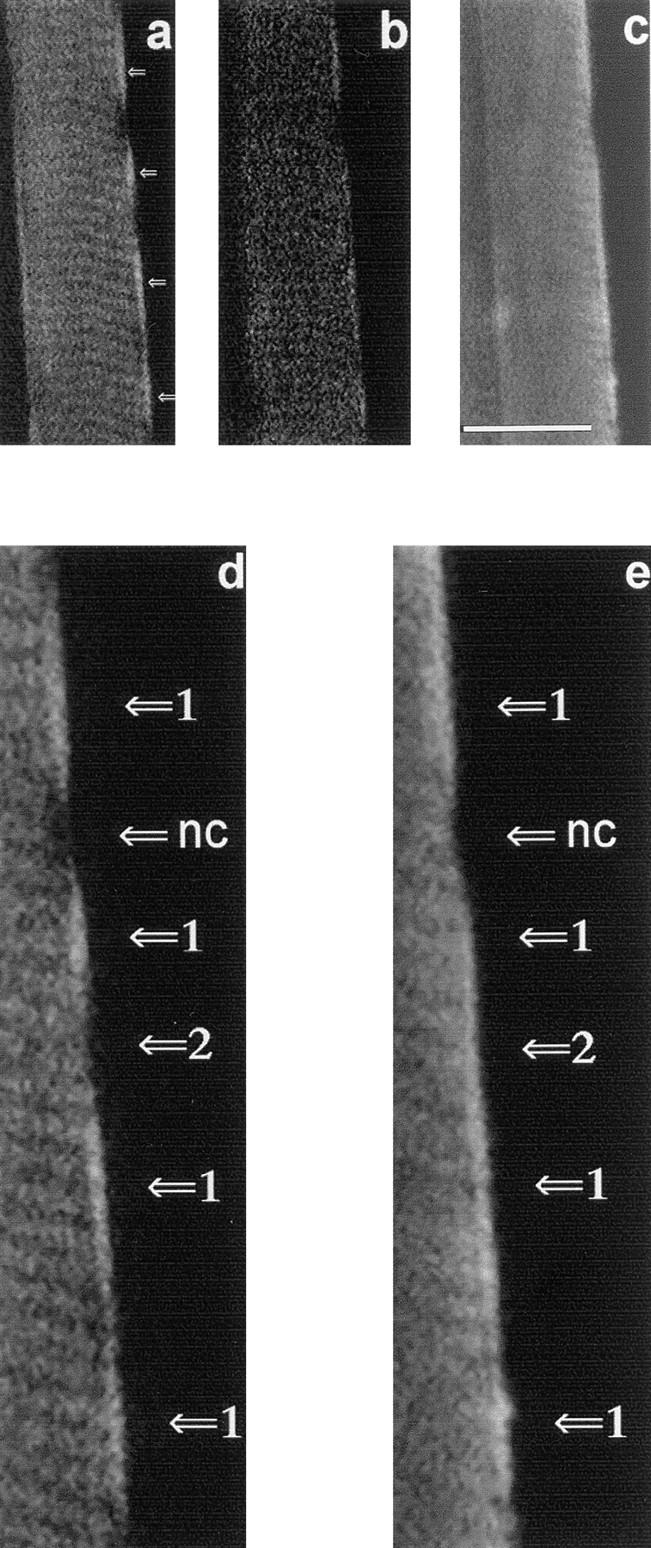
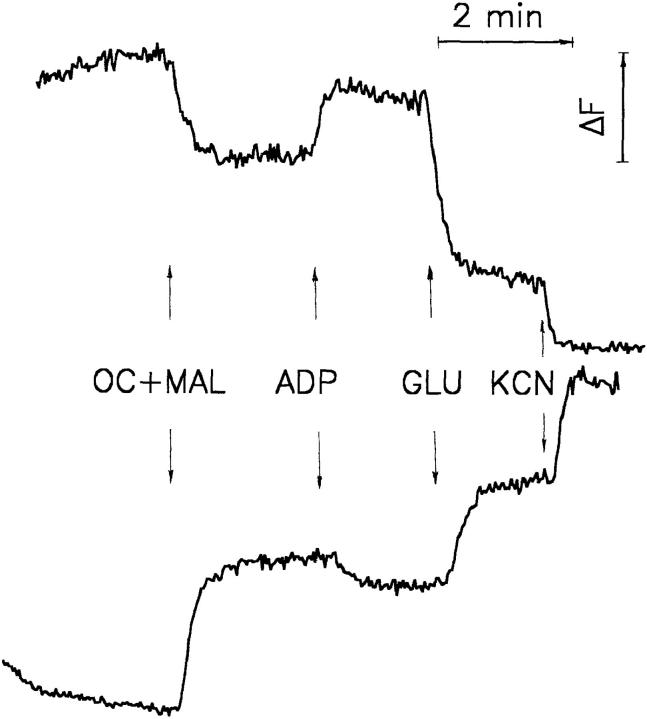
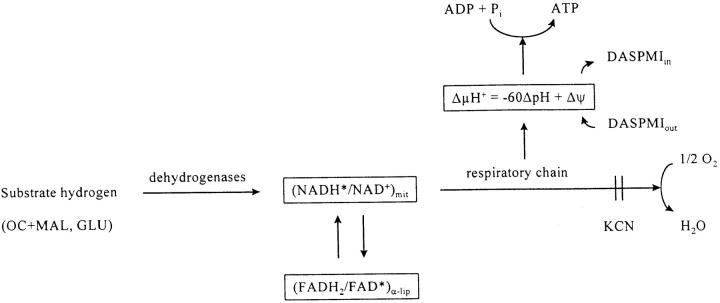
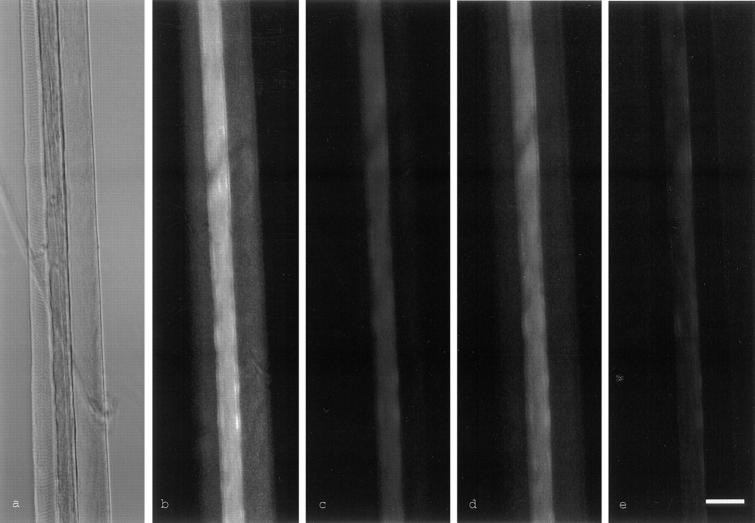
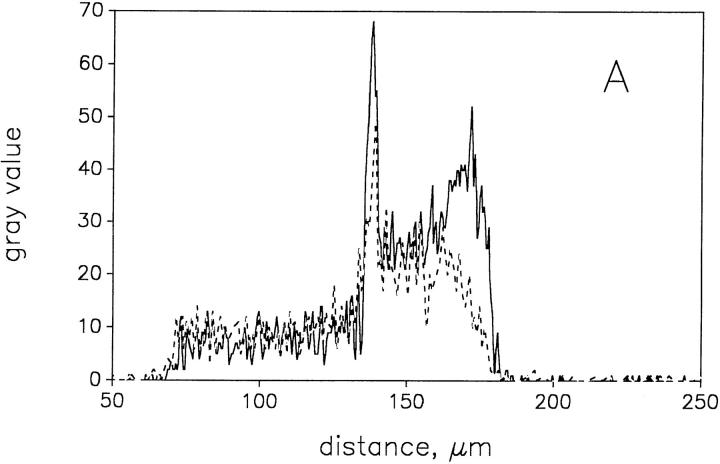
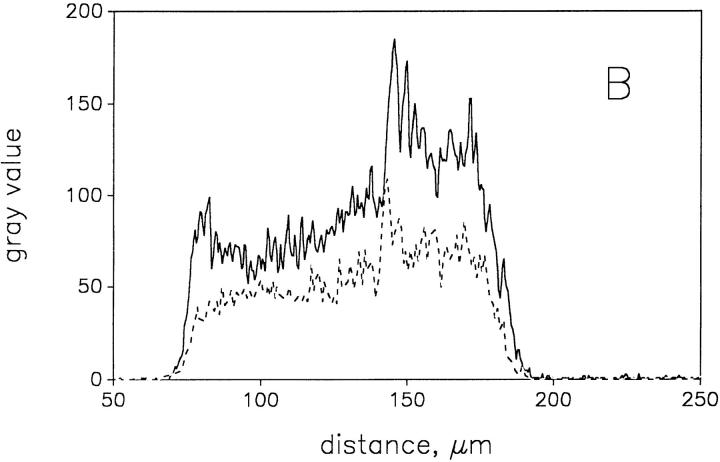
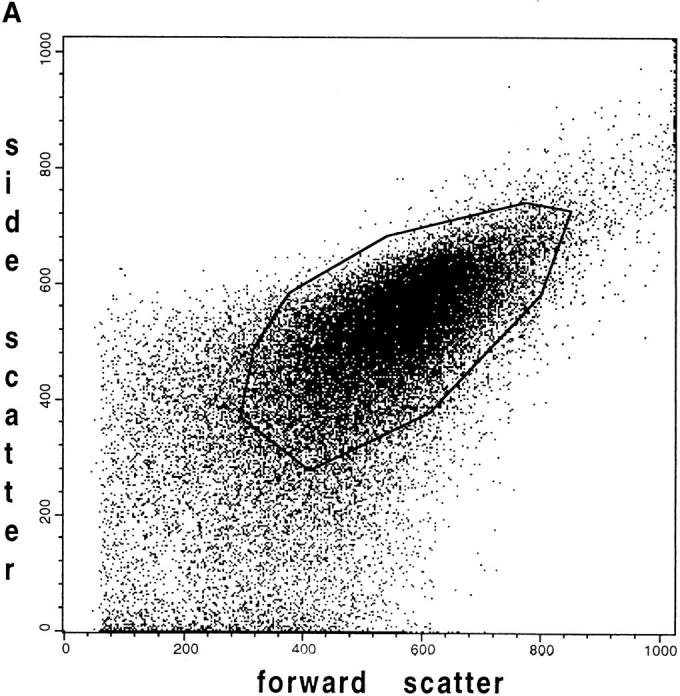
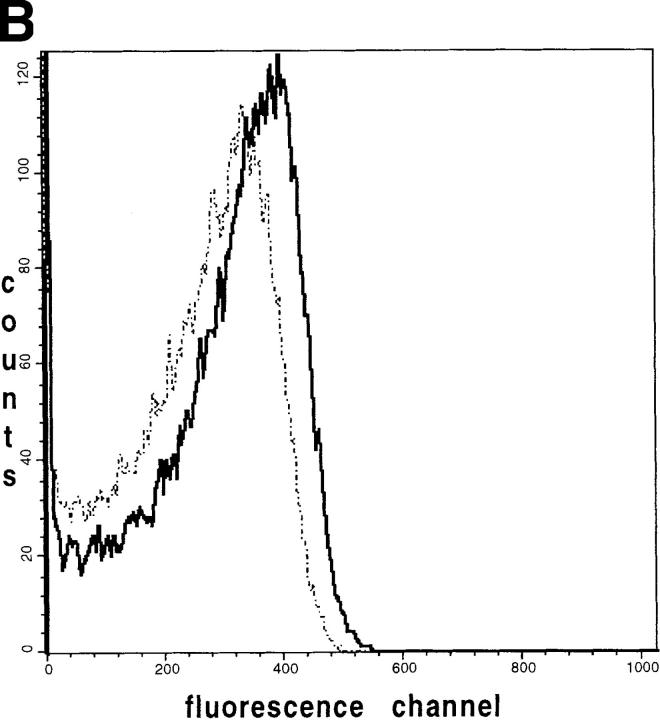
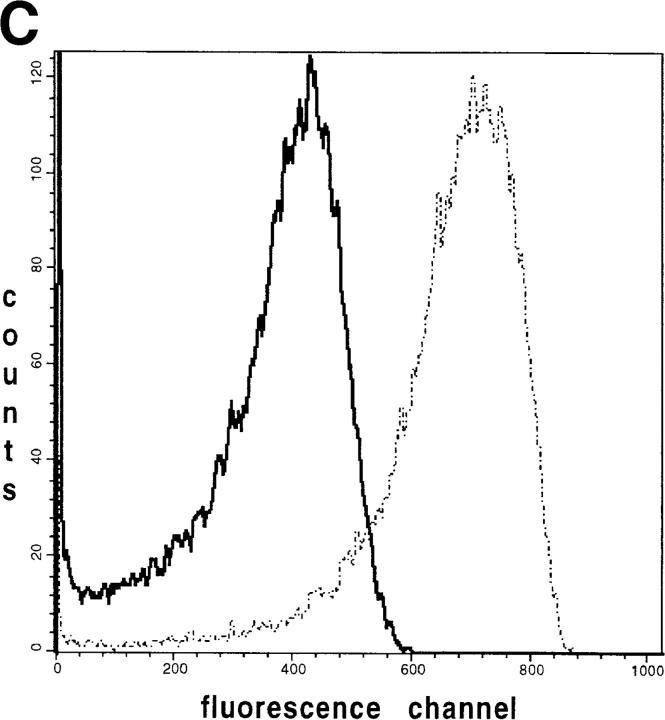
Confocal laser-scanning and digital fluorescence imaging microscopy were used to quantify the mitochondrial autofluorescence changes of NAD(P)H and flavoproteins in unfixed saponin-permeabilized myofibers from mice quadriceps muscle tissue. Addition of mitochondrial substrates, ADP, or cyanide led to redox state changes of the mitochondrial NAD system. These changes were detected by ratio imaging of the autofluorescence intensities of fluorescent flavoproteins and NAD(P)H, showing inverse fluorescence behavior. The flavoprotein signal was colocalized with the potentiometric mitochondria-specific dye dimethylaminostyryl pyridyl methyl iodide (DASPMI), or with MitoTrackerTM Green FM, a constitutive marker for mitochondria. Within individual myofibers we detected topological mitochondrial subsets with distinct flavoprotein autofluorescence levels, equally responding to induced rate changes of the oxidative phosphorylation. The flavoprotein autofluorescence levels of these subsets differed by a factor of four. This heterogeneity was substantiated by flow-cytometric analysis of flavoprotein and DASPMI fluorescence changes of individual mitochondria isolated from mice skeletal muscle. Our data provide direct evidence that mitochondria in single myofibers are distinct subsets at the level of an intrinsic fluorescent marker of the mitochondrial NAD-redox system. Under the present experimental conditions these subsets show similar functional responses.


Figures

Figure 4
Figure 4
Confocal laser-scanning micrographs showing the autofluorescence of flavoproteins (a, b, a′, b′) and the fluorescence signal of the mitochondrial marker DASPMI (c, d, c′, d′) within three different saponin-permeabilized mouse quadriceps muscle fibers. One single confocal plane across these fibers is illustrated in (a–d); one cross-section, reconstructed from a stack of 130 different confocal planes (z-stack), is shown in (a′–d′). The arrowheads in a indicate the site of the reconstructed cross-section. a and a′, oxidized state; b and b′, addition of 10 mM glutamate and 5 mM malate; c and c′, addition of 5 μM DASPMI; d and d′, addition of 5 μM TTFB. To visualize the DASPMI signal (c and c′, d and d′) the laser excitation energy was reduced to 30%. Bar, 50 μm.
Figure 6
Figure 6
Confocal laser-scanning micrographs illustrating topological subsets of mitochondria by colocalization of the flavoprotein autofluorescence and the fluorescence of the mitochondrial marker MitoTracker™ Green FM. A confocal plane across one single mouse quadriceps muscle fiber is shown. (a) Flavoprotein autofluorescence in the oxidized state; (b) flavoprotein autofluorescence after addition of 10 mM glutamate and 5 mM malate; and (c) fluorescence signal obtained after 40 min of incubation with 250 nM of MitoTracker™ Green FM using reduced laser excitation (to 30%). The highest flavoprotein fluorescence in the subsarcolemmal area is indicated in a (arrows). A 2.2-fold magnification of the subsarcolemmal area (a and c) is illustrated in d and e. Different fluorescence signal combinations are indicated by arrows. Arrows 1, flavoprotein fluorescence–positive/MitoTracker™ Green FM fluorescence–positive mitochondria; arrows 2, flavoprotein fluorescence–negative/MitoTracker™ Green FM fluorescence–positive mitochondria. Note that a subsarcolemmal area containing a myonucleus is spared for both fluorescence signals (arrows nc). Bar, 25 μm.
Figure 1
Figure 1
Plot of the fluorescence changes of NAD(P)H and flavoproteins in bundles of saponin-permeabilized mouse quadriceps muscle fibers. Top trace: flavoprotein fluorescence obtained by 488-nm argon ion laser excitation and registration of the 525-nm emission signal. Bottom trace: NAD(P)H fluorescence obtained by 325-nm HeCd laser excitation and registration of the 450-nm emission signal. Approximately 5 mg of wet weight muscle fibers were attached to glass wool and perfused as described (Kunz et al., 1994). Additions: OC (octanoylcarnitine), 1 mM; MAL (malate), 5 mM; ADP, 1 mM; GLU (glutamate), 10 mM; KCN, 4 mM.
Figure 2
Figure 2
Flow diagram of reducing equivalents (the fluorescent forms are marked with asterisks) showing the correlation of the redox states of the mitochondrial NAD system and the FAD of α-lipoamide dehydrogenase with the mitochondrial membrane potential and the phosphorylation of ADP.
Figure 3
Figure 3
Phase contrast and video-autofluorescence ratio images (flavoprotein/ NAD[P]H) of three saponin-permeabilized mouse quadriceps muscle fibers. Digital video images of NAD(P)H and flavoprotein autofluorescences were obtained with an Olympus IX-70 microscope equipped with a Kappa CF 8/1 DXC charge-coupled device camera using 366-nm (NAD[P]H, NU filter) and 470-nm (flavoprotein, NIBA filter) excitation, respectively. To visualize metabolic effects on the mitochondria, the flavoprotein image was divided by the NAD(P)H image. a, phase contrast; b, oxidized state; c, addition of 1 mM octanoylcarnitine and 5 mM malate; d, addition of 1 mM ADP; e, addition of 4 mM KCN and 10 mM glutamate. Bar, 50 μm.
Figure 5
Figure 5
Gray value histograms of the confocal planes shown in Fig. 4. The histograms were extracted from the images shown in Fig. 4, a–d, at the site marked by arrowheads in Fig. 4 a. (A) solid line, oxidized state (corresponding to Fig. 4 a); dashed line, addition of 10 mM glutamate and 5 mM malate (corresponding to Fig. 4 b). (B) solid line, addition of 5 μM DASPMI (corresponding to Fig. 4 c); dashed line, addition of 5 μM TTFB (corresponding to Fig. 4 d).
Figure 5
Figure 5
Gray value histograms of the confocal planes shown in Fig. 4. The histograms were extracted from the images shown in Fig. 4, a–d, at the site marked by arrowheads in Fig. 4 a. (A) solid line, oxidized state (corresponding to Fig. 4 a); dashed line, addition of 10 mM glutamate and 5 mM malate (corresponding to Fig. 4 b). (B) solid line, addition of 5 μM DASPMI (corresponding to Fig. 4 c); dashed line, addition of 5 μM TTFB (corresponding to Fig. 4 d).
Figure 7
Figure 7
Flow-cytometric analysis showing the fluorescence distribution of flavoproteins and DASPMI in individual mice muscle mitochondria. Mice skeletal muscle mitochondria were isolated according to Wisniewski et al. (1993) and then suspended at 0.3 mg/ml in the medium for measurements. (A) Forward versus side scatter plot of the mitochondrial suspension. Each point is an individual mitochondrion. The mitochondria analyzed in B and C are located within the polygon area (gate). (B) Solid line, distribution of the flavoprotein autofluorescence intensities of individual mitochondria in the oxidized state; dashed line, distribution of the flavoprotein autofluorescence intensities after the addition of 10 mM glutamate and 5 mM malate. (C) Dashed line, distribution of fluorescence intensities of mitochondria after the addition of 5 μM DASPMI; solid line, distribution of fluorescence intensities after the addition of 5 μM TTFB.
Figure 7
Figure 7
Flow-cytometric analysis showing the fluorescence distribution of flavoproteins and DASPMI in individual mice muscle mitochondria. Mice skeletal muscle mitochondria were isolated according to Wisniewski et al. (1993) and then suspended at 0.3 mg/ml in the medium for measurements. (A) Forward versus side scatter plot of the mitochondrial suspension. Each point is an individual mitochondrion. The mitochondria analyzed in B and C are located within the polygon area (gate). (B) Solid line, distribution of the flavoprotein autofluorescence intensities of individual mitochondria in the oxidized state; dashed line, distribution of the flavoprotein autofluorescence intensities after the addition of 10 mM glutamate and 5 mM malate. (C) Dashed line, distribution of fluorescence intensities of mitochondria after the addition of 5 μM DASPMI; solid line, distribution of fluorescence intensities after the addition of 5 μM TTFB.

Similar articles

Cited by

References

    1. Altschuld RA, Wenger WC, Lamka KG, Kindig OR, Capen CC, Mizuhira V, van der Heide RS, Brierley GP. Structural and functional properties of adult rat heart myocytes lysed with digitonin. J Biol Chem. 1985;260:14325–14334. - PubMed
    1. Bereiter-Hahn J, Voth M. Dynamics of mitochondria in living cells: shape changes, dislocations, fusion, and fission of mitochondria. Microsc Res Tech. 1994;27:198–219. - PubMed
    1. Chemnitius JM, Manglitz T, Kloeppel M, Doenst T, Schwartz P, Kreuzer H, Zech R. Rapid preparation of subsarcolemmal and interfibrillar mitochondrial subpopulations from cardiac muscle. Int J Biochem. 1993;25:589–596. - PubMed
    1. Chen LB. Fluorescent labeling of mitochondria. Methods Cell Biol. 1989;29:103–123. - PubMed
    1. Cogswell AM, Stevens RJ, Hood DA. Properties of skeletal muscle mitochondria isolated from subsarcolemmal and intermyofibrillar regions. Am J Physiol. 1993;264:C383–C389. - PubMed

Publication types