. 1998 Mar 9;140(5):1101-11.
doi: 10.1083/jcb.140.5.1101.

Differential targeting of vesicular stomatitis virus G protein and influenza virus hemagglutinin appears during myogenesis of L6 muscle cells

Affiliations

Differential targeting of vesicular stomatitis virus G protein and influenza virus hemagglutinin appears during myogenesis of L6 muscle cells

P Rahkila et al. J Cell Biol. .

Abstract

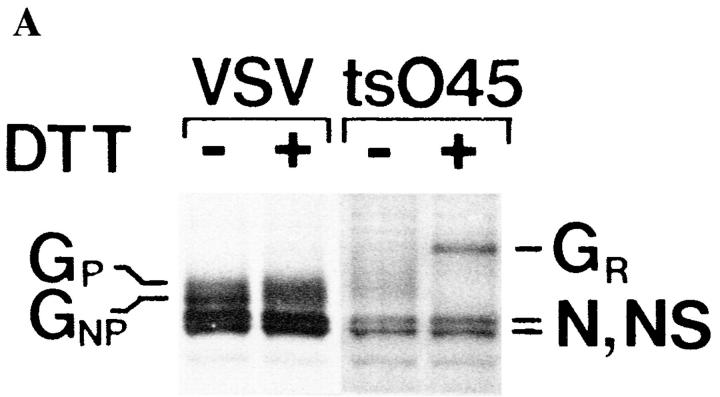
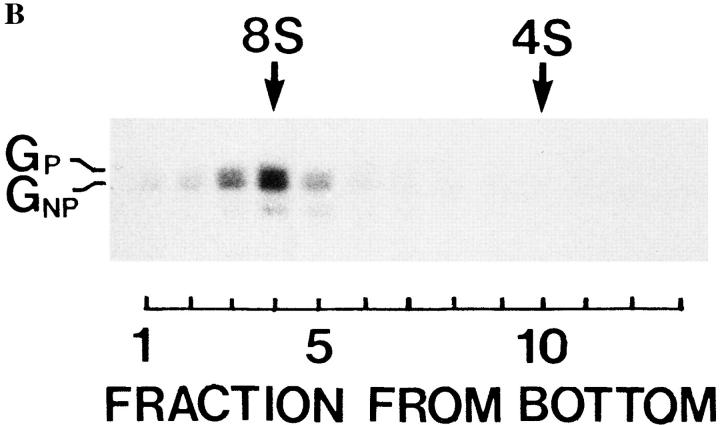
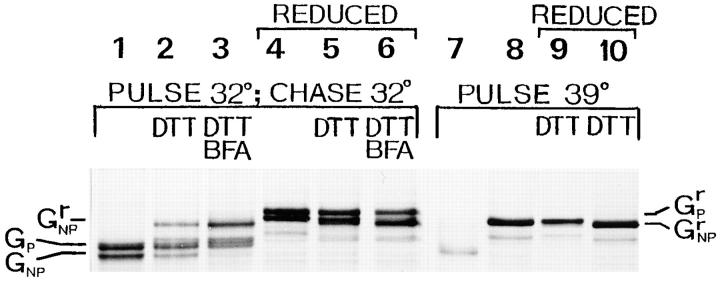
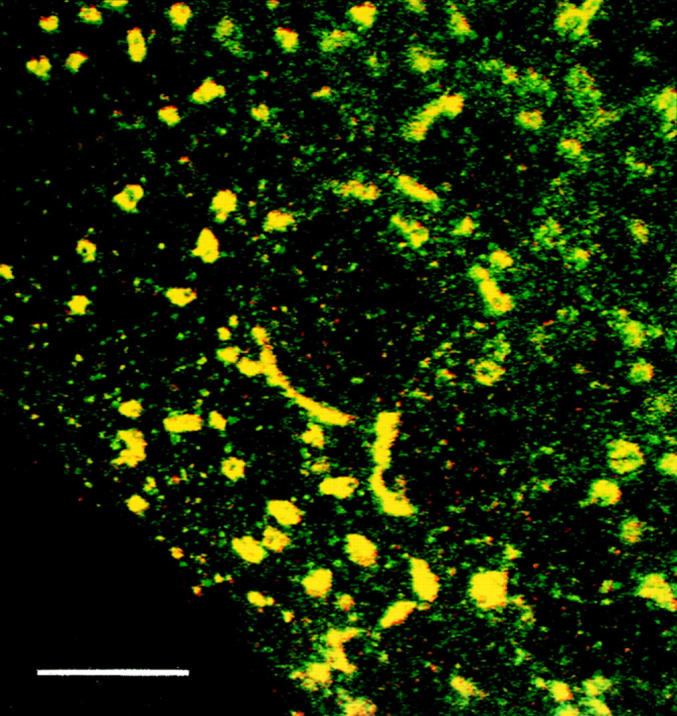
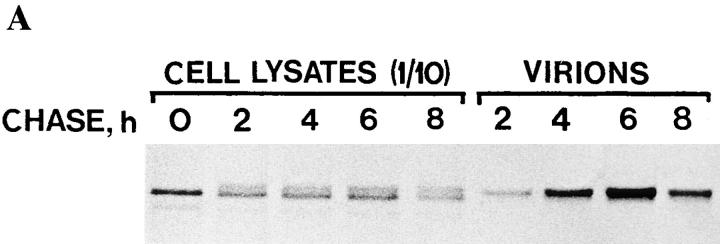
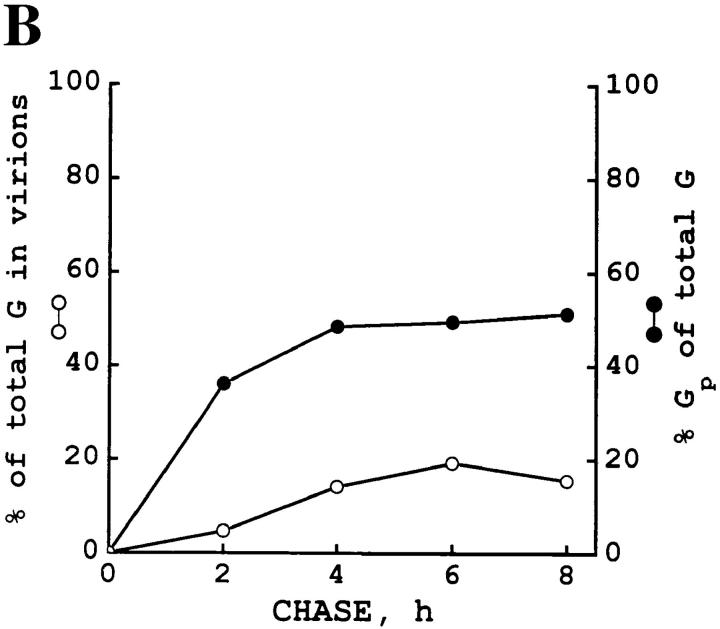
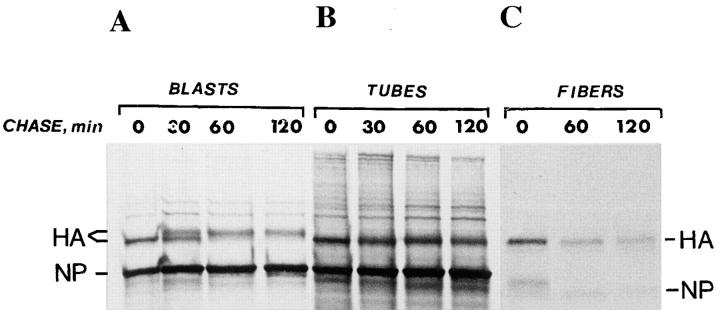
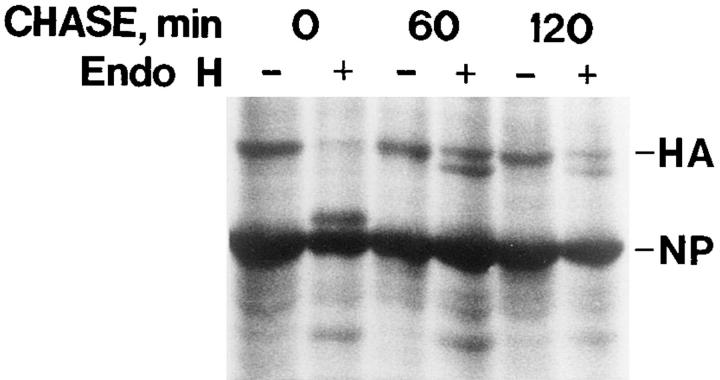
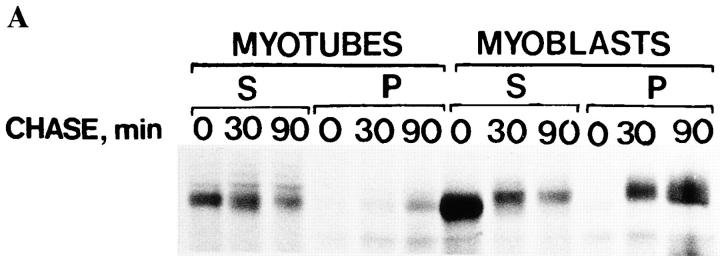
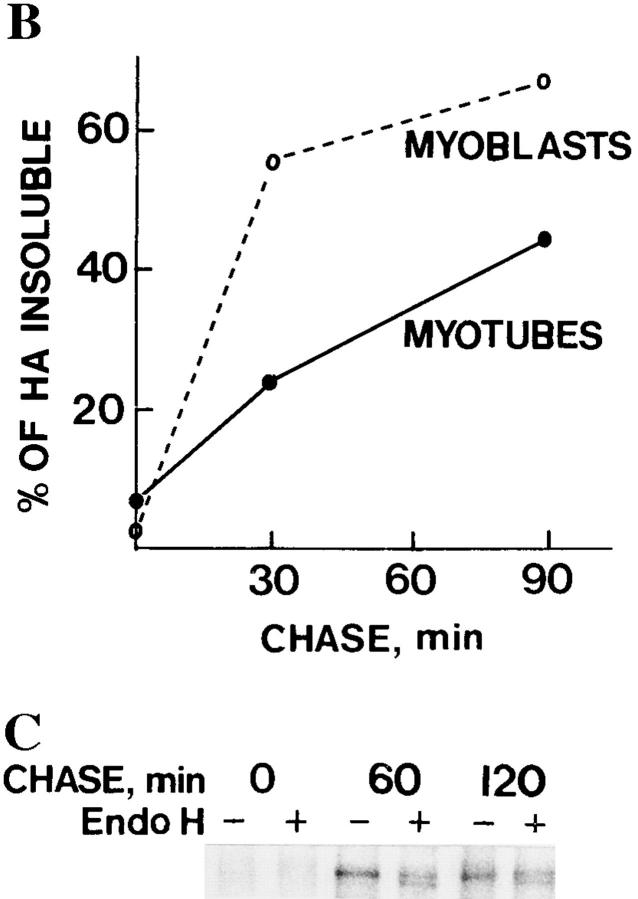
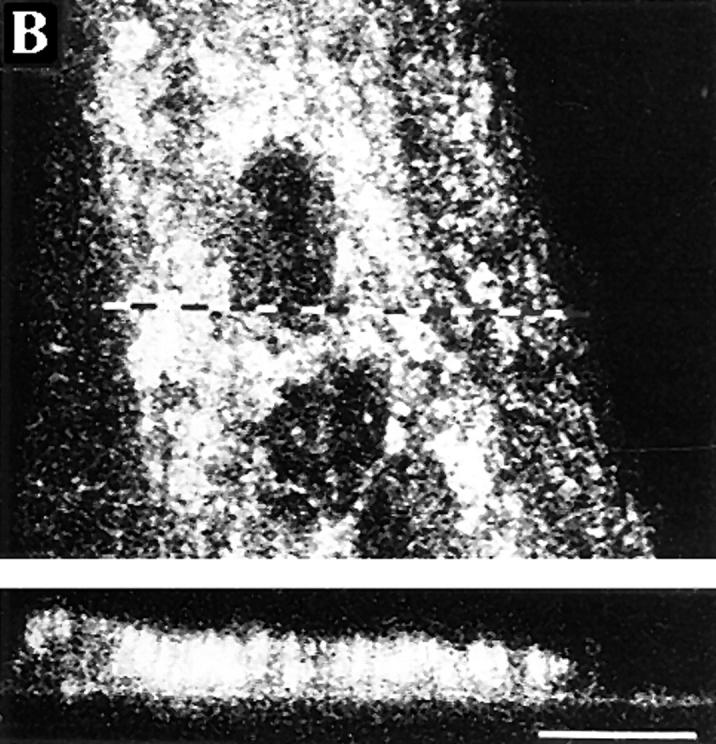
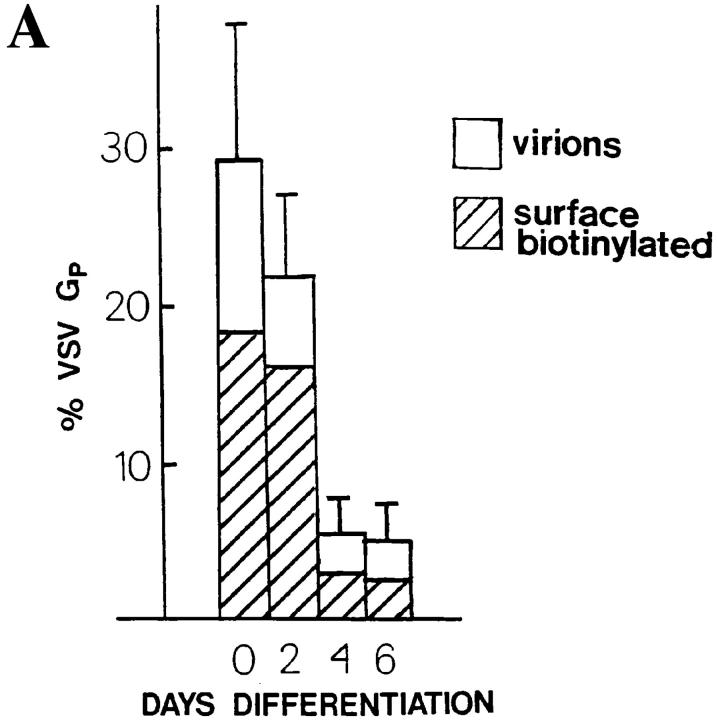
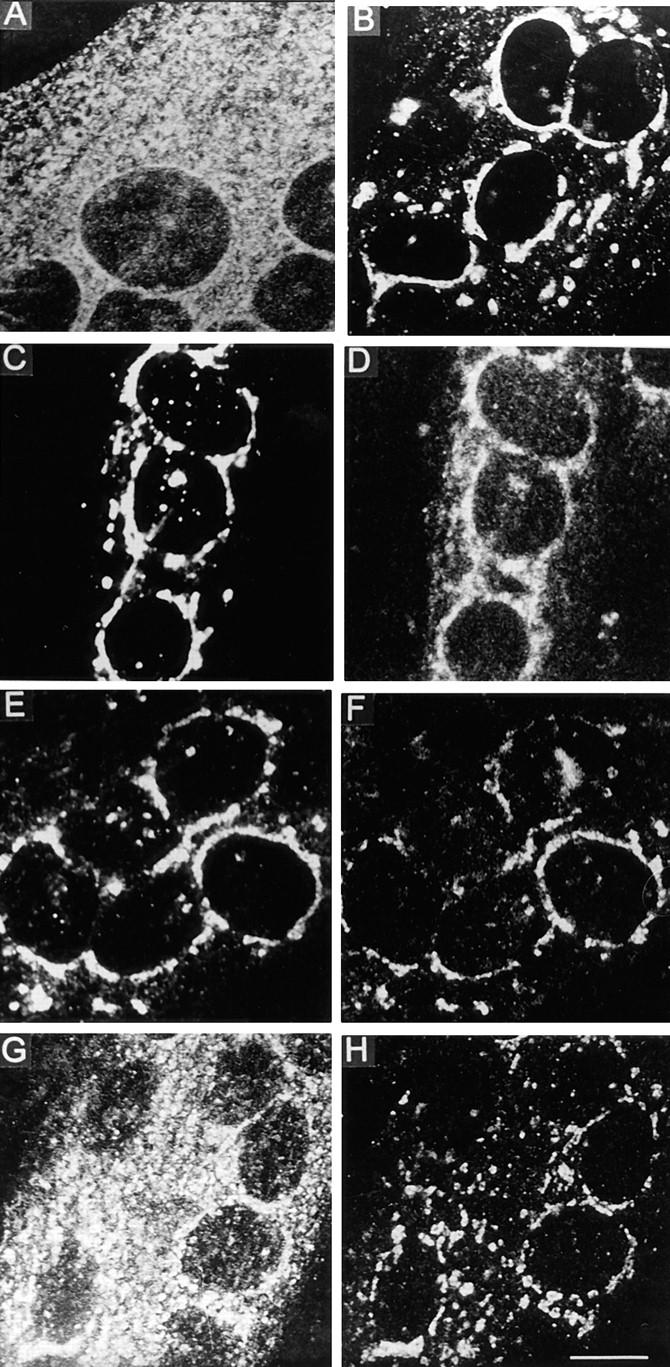
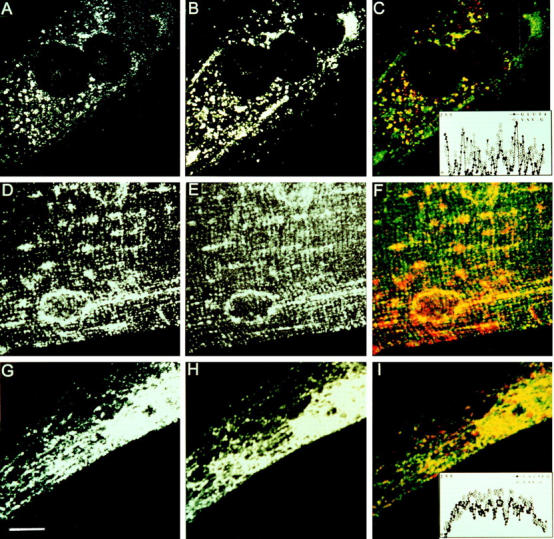
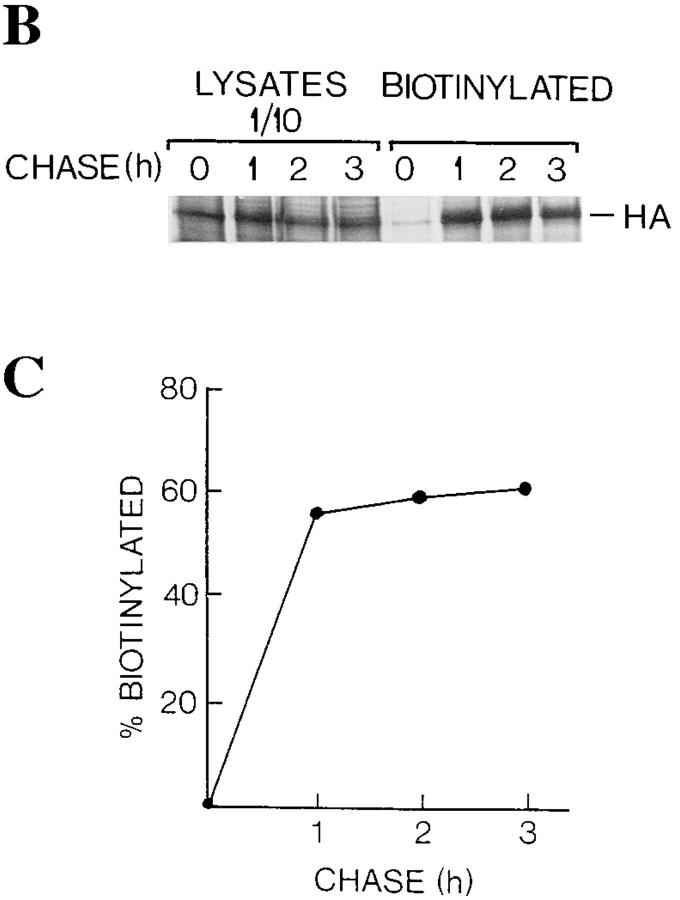
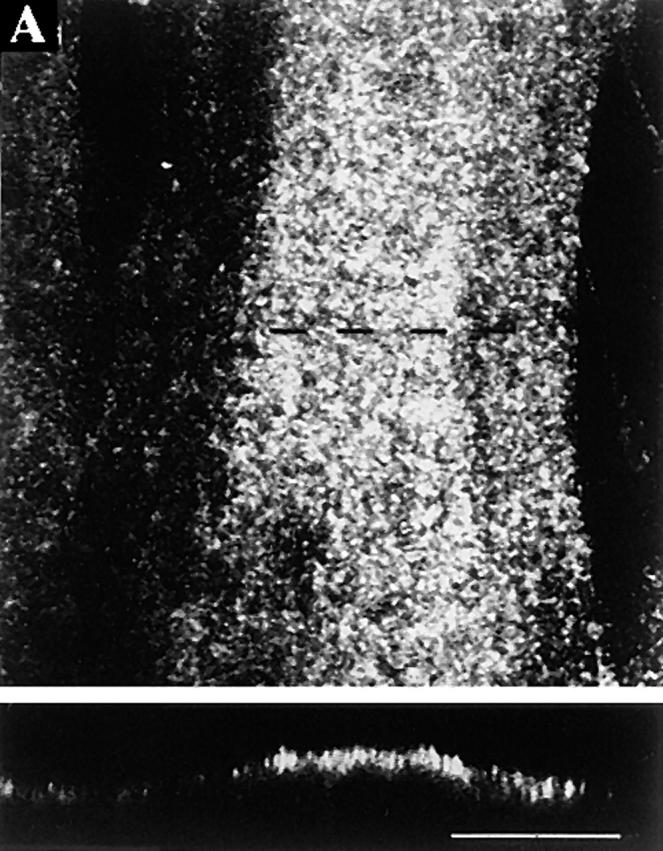
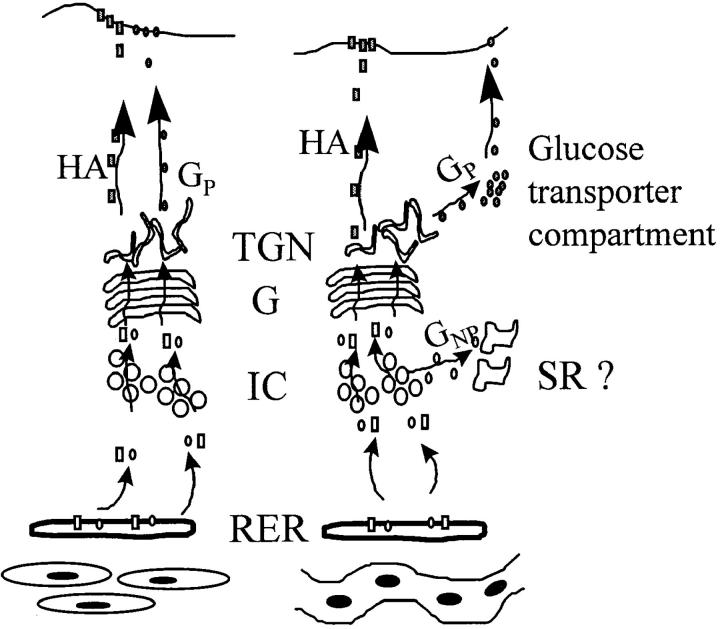
Exocytic organelles undergo profound reorganization during myoblast differentiation and fusion. Here, we analyzed whether glycoprotein processing and targeting changed during this process by using vesicular stomatitis virus (VSV) G protein and influenza virus hemagglutinin (HA) as models. After the induction of differentiation, the maturation and transport of the VSV G protein changed dramatically. Thus, only half of the G protein was processed and traveled through the Golgi, whereas the other half remained unprocessed. Experiments with the VSV tsO45 mutant indicated that the unprocessed form folded and trimerized normally and then exited the ER. It did not, however, travel through the Golgi since brefeldin A recalled it back to the ER. Influenza virus HA glycoprotein, on the contrary, acquired resistance to endoglycosidase H and insolubility in Triton X-100, indicating passage through the Golgi. Biochemical and morphological assays indicated that the HA appeared at the myotube surface. A major fraction of the Golgi-processed VSV G protein, however, did not appear at the myotube surface, but was found in intracellular vesicles that partially colocalized with the regulatable glucose transporter. Taken together, the results suggest that, during early myogenic differentiation, the VSV G protein was rerouted into developing, muscle-specific membrane compartments. Influenza virus HA, on the contrary, was targeted to the myotube surface.


Figures

Figure 1
Figure 1
The processed and the nonprocessed G protein forms in myotubes fold and trimerize normally. (A) VSV-infected myotubes were labeled for 10 min with [35S]methionine, followed by a 60-min chase at 37°C. After the chase, cells were incubated for 15 min with or without 5 mM DTT at 37°C. Myotubes were then solubilized and followed by analysis by SDS-PAGE under nonreducing conditions. Neither the processed (GP) nor the nonprocessed (GN P) VSV G protein was affected by the reducing agent. When myotubes infected with the tsO45 mutant virus were labeled with [35S]methionine at 39°C and then treated for 15 min with DTT, the G protein quantitatively shifted into a more slowly migrating form (GR). N and NS are nucleocapsid proteins. (B) Myotubes were labeled with [35S]methionine for 10 min, followed by a 90-min chase, and then solubilized under acidic conditions as described (Doms et al., 1987). Sucrose density–gradient centrifugation was then performed in a Beckman SW 50 rotor for 15 h at 45,000 rpm at 4°C. Gradient fractions were subjected to SDS-PAGE under reducing conditions. Both G protein forms (GP and GNP) cosediment at ∼8S, indicating a trimeric oligomerization state for both the processed and nonprocessed G proteins.
Figure 1
Figure 1
The processed and the nonprocessed G protein forms in myotubes fold and trimerize normally. (A) VSV-infected myotubes were labeled for 10 min with [35S]methionine, followed by a 60-min chase at 37°C. After the chase, cells were incubated for 15 min with or without 5 mM DTT at 37°C. Myotubes were then solubilized and followed by analysis by SDS-PAGE under nonreducing conditions. Neither the processed (GP) nor the nonprocessed (GN P) VSV G protein was affected by the reducing agent. When myotubes infected with the tsO45 mutant virus were labeled with [35S]methionine at 39°C and then treated for 15 min with DTT, the G protein quantitatively shifted into a more slowly migrating form (GR). N and NS are nucleocapsid proteins. (B) Myotubes were labeled with [35S]methionine for 10 min, followed by a 90-min chase, and then solubilized under acidic conditions as described (Doms et al., 1987). Sucrose density–gradient centrifugation was then performed in a Beckman SW 50 rotor for 15 h at 45,000 rpm at 4°C. Gradient fractions were subjected to SDS-PAGE under reducing conditions. Both G protein forms (GP and GNP) cosediment at ∼8S, indicating a trimeric oligomerization state for both the processed and nonprocessed G proteins.
Figure 2
Figure 2
Thermosensitivity of the mutant tsO45 G protein in myotubes. Myotubes were infected with the VSV tsO45 mutant and then maintained at 32°C. They were pulse labeled with [35S]methionine for 10 min either at 32°C, followed by a 90-min chase period at 32°C (lanes 1–6), or pulse labeled at 39°C without the chase period (lanes 7–10). Indicated samples were next treated with DTT (5 mM) for 10 min at 39°C. Cells were lysed and then the lysates were subjected to SDS-PAGE without reduction (lanes 1–3 and 7 and 8) or after reduction (marked REDUCED, lanes 4–6 and 9 and 10). After a chase at 32°C, both the processed (GP) and nonprocessed (GNP) G protein forms run faster on nonreducing SDS-PAGE (lane 1) as compared to analysis after reduction (lane 4; GrP, GrNP). Shifting the temperature to 39°C for 10 min in the presence of DTT results in the unfolding of some G protein, as indicated by SDS-PAGE, of a nonreduced sample (lane 2). Lane 5 represents an identical sample analyzed under reducing conditions. When brefeldin A (BFA; 5 μg/ml) was present during the last 20 min of the chase and during the 10-min period at 39°C, practically all the nonprocessed G protein unfolded (lane 3). Lane 6 shows the brefeldin A–treated sample analyzed under reducing conditions. Lane 7 shows a control where a 10-min pulse was performed at 39°C, whereas lane 8 shows a control that was pulse labeled for 10 min at 39°C, and then followed by a 10-min chase at 39°C in the presence of 5 mM DTT. Lanes 9 and 10 show the corresponding samples analyzed under reducing conditions.
Figure 3
Figure 3
Localization of the VSV tsO45 G protein during a 15°C block. Infected myotubes were maintained for 5 h at 39°C and then followed by a 2-h incubation at 15°C. Double immunofluorescence staining for tsO45 G protein (red) and p58, a marker of the intermediate compartment (green), shows colocalization, indicated by yellow. Monoclonal antibodies against the VSV G protein cytoplasmic tail were used and then visualized with anti–mouse IgG conjugated to Texas red, whereas polyclonal antibodies and anti–rabbit IgG conjugated to FITC were used to detect the p58 protein. Bar, 10 μm.
Figure 4
Figure 4
A fraction of the VSV G protein remains nonprocessed during a prolonged chase and this form does not appear in viral particles. Infected myofibers were labeled for 10 min with [35S]methionine and then followed by chase periods of 0, 2, 4, 6, and 8 h. After each chase period, cells were solubilized with a buffer containing 1% Triton X-100, 1% deoxycholate, and 1 mM PMSF. The media were collected and clarified by a 5-min centrifugation at 5,000 g, and then centrifugation for 60 min at 75,000 g and 4°C to pellet the virions. (A) SDS-PAGE shows the nonprocessed and processed G protein bands in the cell lysates although only the processed form is present in the virions. 10% of the cell lysates were applied on the gel whereas virions were loaded quantitatively. (B) The fraction of the G protein in the virions is shown at each chase timepoint, together with the fraction of the processed G protein (GP) of the total G protein. Total G protein was counted as a sum of the G protein present in the virions and in the cells. For GP, the processed G protein in the cells and in the virions was counted.
Figure 4
Figure 4
A fraction of the VSV G protein remains nonprocessed during a prolonged chase and this form does not appear in viral particles. Infected myofibers were labeled for 10 min with [35S]methionine and then followed by chase periods of 0, 2, 4, 6, and 8 h. After each chase period, cells were solubilized with a buffer containing 1% Triton X-100, 1% deoxycholate, and 1 mM PMSF. The media were collected and clarified by a 5-min centrifugation at 5,000 g, and then centrifugation for 60 min at 75,000 g and 4°C to pellet the virions. (A) SDS-PAGE shows the nonprocessed and processed G protein bands in the cell lysates although only the processed form is present in the virions. 10% of the cell lysates were applied on the gel whereas virions were loaded quantitatively. (B) The fraction of the G protein in the virions is shown at each chase timepoint, together with the fraction of the processed G protein (GP) of the total G protein. Total G protein was counted as a sum of the G protein present in the virions and in the cells. For GP, the processed G protein in the cells and in the virions was counted.
Figure 5
Figure 5
Differentiation of myoblasts into multinucleated muscle cells induces altered HA processing. L6 myoblasts and myotubes were infected with influenza virus and pulse labeled with [35S]methionine for 10 min and then followed by chase periods as indicated. Myoblasts (A) and myotubes (B) were solubilized in SDS sample buffer and then subjected to SDS-PAGE. In myoblasts, a shift to a less mobile form occurred during the chase, wheras such a shift was not seen in myotubes. (C) Isolated rat myofibers were infected for 15 h and then followed by a 10-min pulse and chase times as indicated. Fibers were extracted with PBS containing 1% Triton X-100 and 1% deoxycholate, followed by immunoprecipitation using antibodies against gel-purified HA and immobilized protein A. No mobility shift during the chase occurred with the myofibers. NP indicates nucleocapsid protein.
Figure 6
Figure 6
HA is processed in the myotube Golgi. Myotubes infected with influenza virus were pulse-chase labeled using [35S]methionine. Amantadine (10 μM) was present in the pulse and chase media. Cells were then solubilized with 200 μl of 0.5% SDS in 50 mM Tris buffer, pH 6.8. After heating for 1 min at 96°C, 800 μl of 0.2 M citrate buffer, pH 5.5, was added. Aliquots (100 μl) were then incubated for 16 h at 37°C, with or without endo H (10 mU). The core-glycosylated HA, seen at zero chase time, is fully sensitive to the enzyme, whereas a totally and a partially resistant form are seen at 60- and 120-min chase times. NP indicates nucleocapsid protein.
Figure 7
Figure 7
HA acquires Triton X-100 insolubility in myoblasts and myotubes. Influenza virus-infected myotubes and myoblasts were pulse labeled for 10 min with [35S]methionine and then followed by chase times as indicated. Cells were then extracted with 1% Triton X-100, pH 6.5, and then the soluble fractions (S), as well as the remaining pellets (P), were analyzed by SDS-PAGE. Autoradiograms of the HA bands are shown in A, whereas B shows the relative amounts of the HA remaining insoluble at the indicated chase times. The Triton-insoluble pellets of myotubes were subjected to digestion with endo H and then analyzed by SDS-PAGE, shown in C. Totally and partially endo H–resistant HA forms are seen after a 60- and 120-min chase.
Figure 7
Figure 7
HA acquires Triton X-100 insolubility in myoblasts and myotubes. Influenza virus-infected myotubes and myoblasts were pulse labeled for 10 min with [35S]methionine and then followed by chase times as indicated. Cells were then extracted with 1% Triton X-100, pH 6.5, and then the soluble fractions (S), as well as the remaining pellets (P), were analyzed by SDS-PAGE. Autoradiograms of the HA bands are shown in A, whereas B shows the relative amounts of the HA remaining insoluble at the indicated chase times. The Triton-insoluble pellets of myotubes were subjected to digestion with endo H and then analyzed by SDS-PAGE, shown in C. Totally and partially endo H–resistant HA forms are seen after a 60- and 120-min chase.
Figure 8
Figure 8
Surface appearance of the VSV G protein decreases during the differentiation of myoblasts into myotubes. (A) Myoblast/myotube cultures were infected with VSV after 0, 2, 4, and 6 d of culture in the differentiation medium. The cells were pulse labeled for 10 min with [35S]methionine and then followed by a 90-min chase and surface biotinylation. Cells were then solubilized and the biotinylated G protein from the lysates adsorbed onto immobilized streptavidin. Conditioning media were also collected and the virions were pelleted. The biotinylated material, cell lysates, and virions were subjected to SDS-PAGE, and the processed G protein bands (GP) quantified using a PhosphorImager. The bars show the percentages of the processed G protein that has externalized (biotinylated G protein and G protein in the virions), in relation to the total GP (cell lysates, biotinylated fractions, and virions). Mean and range of two determinations are shown. Hatched portions show the fraction of GP that was biotinylated and open portions show the fraction of GP in the virions. (B) A confocal section of immunofluorescence staining for the G protein in a permeabilized, 4-d-old VSV-infected myotube. After a 6-h infection period, the cells were incubated with 0.4 mM cycloheximide for 1 h before fixaton. The corresponding xz-section is also shown to indicate that most of the G protein is intracellular. The dotted line shows the position of the xz-section. Polyclonal anti–G protein antibodies were used and TRITC-conjugated anti–rabbit IgG were used for visualization. Bar, 10 μm.
Figure 8
Figure 8
Surface appearance of the VSV G protein decreases during the differentiation of myoblasts into myotubes. (A) Myoblast/myotube cultures were infected with VSV after 0, 2, 4, and 6 d of culture in the differentiation medium. The cells were pulse labeled for 10 min with [35S]methionine and then followed by a 90-min chase and surface biotinylation. Cells were then solubilized and the biotinylated G protein from the lysates adsorbed onto immobilized streptavidin. Conditioning media were also collected and the virions were pelleted. The biotinylated material, cell lysates, and virions were subjected to SDS-PAGE, and the processed G protein bands (GP) quantified using a PhosphorImager. The bars show the percentages of the processed G protein that has externalized (biotinylated G protein and G protein in the virions), in relation to the total GP (cell lysates, biotinylated fractions, and virions). Mean and range of two determinations are shown. Hatched portions show the fraction of GP that was biotinylated and open portions show the fraction of GP in the virions. (B) A confocal section of immunofluorescence staining for the G protein in a permeabilized, 4-d-old VSV-infected myotube. After a 6-h infection period, the cells were incubated with 0.4 mM cycloheximide for 1 h before fixaton. The corresponding xz-section is also shown to indicate that most of the G protein is intracellular. The dotted line shows the position of the xz-section. Polyclonal anti–G protein antibodies were used and TRITC-conjugated anti–rabbit IgG were used for visualization. Bar, 10 μm.
Figure 9
Figure 9
The destination of the VSV G protein in myotubes appears to be an intracellular compartment. VSV tsO45-infected myotubes were maintained for 5 h at 39°C and then stained for the G protein using polyclonal antibodies (A). The temperature was then shifted to 15°C for 2 h, resulting in a staining pattern composed of a perinuclear component and dispersed dots (B). When the temperature was shifted from 39° to 20°C for 2 h, double staining with a monoclonal P5D4 anti–G protein antibody (C) and polyclonal anti-p58 antibodies (D) showed essential colocalization. Double staining for the G protein, using polyclonal antibodies (E), and monoclonal anti–mannosidase II antibody (F), also showed overlapping staining patterns. After the 20°C block, the temperature was raised for 2 h to 32°C (G and H). Double staining for the G protein (G) and mannosidase II (H) now shows that the G protein has left the Golgi compartment. Confocal sections are shown. TRITC-conjugated anti–rabbit IgG and FITC-conjugated anti–mouse IgG were used as secondary antibodies. Bar, 10 μm.
Figure 10
Figure 10
The G protein shows partial colocalization with the regulatable glucose transporter and calsequestrin in muscle cells. (A–C) L6 myotubes were infected with the VSV tsO45 mutant, incubated for 5 h at 39°C, and then followed by a 2-h incubation at 32°C in the presence of 0.4 mM cycloheximide. After permeabilization, double immunofluorescence staining for the regulatable glucose transporter and VSV G protein was performed using polyclonal antibodies for the glucose transporter and P5D4 monoclonal anti–G protein antibody. The glucose transporter was visualized by TRITC-conjugated anti–rabbit IgG (A) and the G protein with FITC-conjugated anti– mouse IgG (B). The color print (C) shows the glucose transporter (red), G protein (green), and colocalization (yellow). The inset is a graphical presentation of a line profile analysis of the fluorescence intensities (y-axis) of the corresponding pixels of glucose transporter (GLUT4) and VSV G protein staining on the x-axis. Arrowheads indicate points of VSV G signal without GLUT4 signal. (D–F) Double labeling for glucose transporter (D) and VSV G protein (E) in an isolated myofiber. Myofibers were infected for 10 h with wtVSV and then followed by a 1-h treatment with cycloheximide (0.4 mM) before fixation. In the color print (F), glucose transporter appears red whereas VSV G protein appears green; yellow indicates colocalization of the two markers. (G–I) Primary myotube culture was infected with recSFV–VSV G particles for 16 h. After 1 h of cycloheximide treatment, cells were fixed, permeabilized, and then subjected to double immunofluorescence staining for calsequestrin and G protein. Calsequestrin was visualized with Texas red–conjugated anti–mouse IgG (G), and then the G protein was visualized using FITC-conjugated anti–rabbit IgG (H). In the color print (I), calsequestrin appears red and G protein appears green; yellow indicates colocalization. The inset in I shows a line profile analysis for calsequestrin and VSV G protein. Matrox Inspector software was used to increase the contrast of the images shown in A–C and G–I. Confocal planes are shown. Bar, 10 μm.
Figure 11
Figure 11
Influenza virus HA is localized at the cell surface in L6 myotubes. Myotubes were maintained in differentiation medium for 3 d and then infected with influenza virus. (A) At 6 h after infection, permeabilized cells were immunostained using antibodies raised against influenza virosomes. A summary projection of 12 confocal sections, scanned at 0.3-μm steps, shows granular staining (top), whereas a xz-section scanned along the dotted line indicates that the granular staining is localized at the cell surface (bottom). (B and C) Influenza virus-infected myotubes were labeled with [35S]methionine for 10 min and then followed by chase periods as indicated. After each chase, cells were subjected to surface biotinylation at 0°C, and then followed by solubilization and adsorbtion of the biotinylated material with immobilized streptavidin. SDS-PAGE profiles of the HA in the cell lysates (10% loaded on the gel) and those bound to streptavidin (100% loaded on the gel) are shown (B). Band intensities were quantified, and then the relative amounts of the HA bound to streptavidin from the total lysates are shown (C). The HA band bound to streptavidin at zero chase time was counted as background. Bar, 10 μm.
Figure 11
Figure 11
Influenza virus HA is localized at the cell surface in L6 myotubes. Myotubes were maintained in differentiation medium for 3 d and then infected with influenza virus. (A) At 6 h after infection, permeabilized cells were immunostained using antibodies raised against influenza virosomes. A summary projection of 12 confocal sections, scanned at 0.3-μm steps, shows granular staining (top), whereas a xz-section scanned along the dotted line indicates that the granular staining is localized at the cell surface (bottom). (B and C) Influenza virus-infected myotubes were labeled with [35S]methionine for 10 min and then followed by chase periods as indicated. After each chase, cells were subjected to surface biotinylation at 0°C, and then followed by solubilization and adsorbtion of the biotinylated material with immobilized streptavidin. SDS-PAGE profiles of the HA in the cell lysates (10% loaded on the gel) and those bound to streptavidin (100% loaded on the gel) are shown (B). Band intensities were quantified, and then the relative amounts of the HA bound to streptavidin from the total lysates are shown (C). The HA band bound to streptavidin at zero chase time was counted as background. Bar, 10 μm.
Figure 12
Figure 12
Postulated transport routes for VSV G protein and influenza HA in L6 myoblasts (left) and in multinucleated myotubes (right). HA travels to the cell surface both in myoblasts and myotubes. In myoblasts, VSV G protein is transported to the cell surface, but in myotubes, it is transported to a pre-Golgi compartment, suggested to be SR, and to a post-Golgi compartment postulated to represent the recruitable glucose transporter compartment. RER indicates rough endoplasmic reticulum; IC indicates intermediate compartment; G indicates Golgi apparatus; TGN indicates trans-Golgi network; GP indicates processed G protein; GNP indicates nonprocessed G protein.

Similar articles

Cited by

References

    1. Balch WE, Keller DS. ATP-coupled transport of vesicular stomatitis virus G protein. Functional boundaries of secretory compartments. J Biol Chem. 1986;261:14690–14696. - PubMed
    1. Baron MD, Garoff H. Mannosidase II and the 135 kDa Golgi-specific antigen recognized monoclonal antibody 53FC3 are the same dimeric protein. J Biol Chem. 1990;265:19928–19931. - PubMed
    1. Bekoff A, Betz W. Properties of isolated adult rat muscle fibers maintained in tissue culture. J Physiol. 1977;271:537–547. - PMC - PubMed
    1. Bennett MK, Wandinger-Ness A, Simons K. Release of putative exocytic transport vesicles from perforated MDCK cells. EMBO (Eur Mol Biol Organ) J. 1988;7:4075–4085. - PMC - PubMed
    1. Braakman I, Helenius J, Helenius A. Manipulating disulfide bond formation and protein folding in the endoplasmic reticulum. EMBO (Eur Mol Biol Organ) J. 1992;11:1717–1722. - PMC - PubMed

Publication types

Substances