. 1998 Mar 9;140(5):1211-25.
doi: 10.1083/jcb.140.5.1211.

Intracellular localization of phosphatidylinositide 3-kinase and insulin receptor substrate-1 in adipocytes: potential involvement of a membrane skeleton

Affiliations

Intracellular localization of phosphatidylinositide 3-kinase and insulin receptor substrate-1 in adipocytes: potential involvement of a membrane skeleton

S F Clark et al. J Cell Biol. .

Abstract

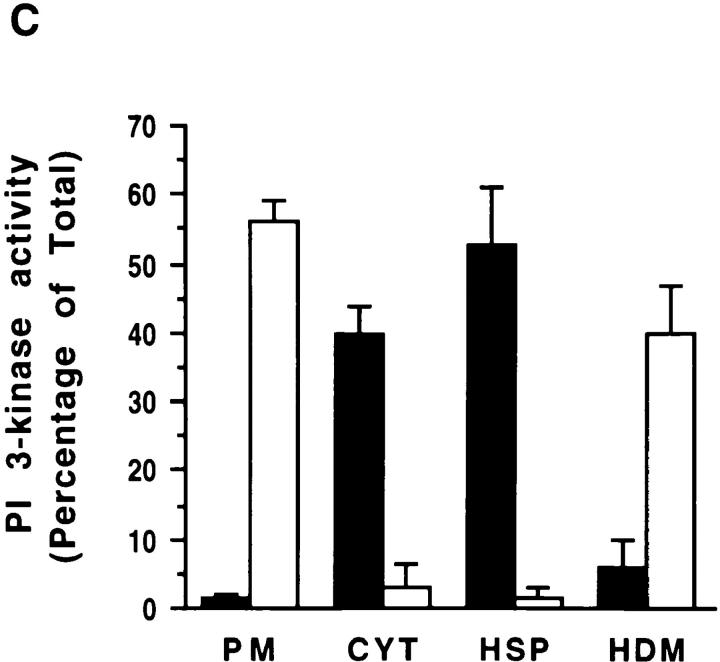
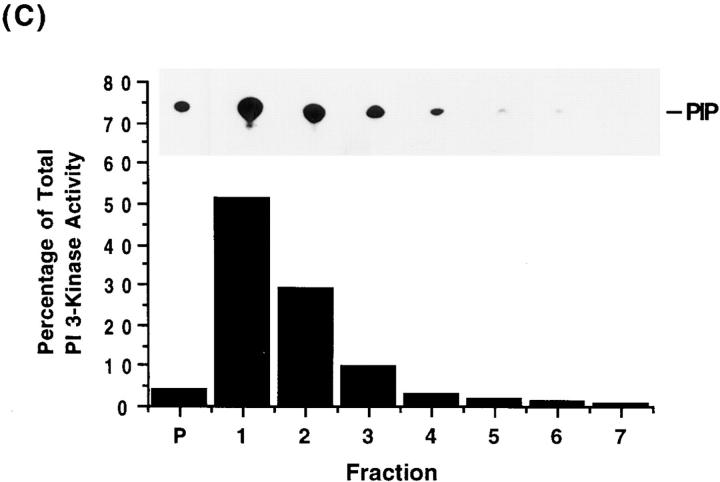
Phosphatidylinositide (PI) 3-kinase binds to tyrosyl-phosphorylated insulin receptor substrate-1 (IRS-1) in insulin-treated adipocytes, and this step plays a central role in the regulated movement of the glucose transporter, GLUT4, from intracellular vesicles to the cell surface. PDGF, which also activates PI 3-kinase in adipocytes, has no significant effect on GLUT4 trafficking in these cells. We propose that this specificity may be mediated by differential localization of PI 3-kinase in response to insulin versus PDGF activation. Using subcellular fractionation in 3T3-L1 adipocytes, we show that insulin- and PDGF-stimulated PI 3-kinase activities are located in an intracellular high speed pellet (HSP) and in the plasma membrane (PM), respectively. The HSP is also enriched in IRS-1, insulin-stimulated tyrosyl-phosphorylated IRS-1 and intracellular GLUT4-containing vesicles. Using sucrose density gradient sedimentation, we have been able to segregate the HSP into two separate subfractions: one enriched in IRS-1, tyrosyl-phosphorylated IRS-1, PI 3-kinase as well as cytoskeletal elements, and another enriched in membranes, including intracellular GLUT4 vesicles. Treatment of the HSP with nonionic detergent, liberates all membrane constituents, whereas IRS-1 and PI 3-kinase remain insoluble. Conversely, at high ionic strength, membranes remain intact, whereas IRS-1 and PI 3-kinase become freely soluble. We further show that this IRS-1-PI 3-kinase complex exists in CHO cells overexpressing IRS-1 and, in these cells, the cytosolic pool of IRS-1 and PI 3-kinase is released subsequent to permeabilization with Streptolysin-O, whereas the particulate fraction of these proteins is retained. These data suggest that IRS-1, PI 3-kinase, as well as other signaling intermediates, may form preassembled complexes that may be associated with the actin cytoskeleton. This complex must be in close apposition to the cell surface, enabling access to the insulin receptor and presumably other signaling molecules that somehow confer the absolute specificity of insulin signaling in these cells.


Figures

Figure 1
Figure 1
Effect of insulin and PDGF on GLUT4 translocation in adipocytes. 3T3-L1 adipocytes cultured on coverslips were brought to basal conditions and incubated with insulin (1 μM), or PDGF (100 ng/ml), or no additions (Control) for 15 min at 37°C. Cells were washed and sonicated to yield plasma membrane fragments (PM lawns). PM lawns were immunolabeled with anti-GLUT4 antibody and visualized using immunofluorescence microscopy. The results shown are representative of three independent experiments.
Figure 2
Figure 2
Effect of insulin and PDGF on PI 3-kinase activity. Whole cell lysates from 3T3-L1 adipocytes incubated with insulin (I; 1 μM) or PDGF (P; 100 ng/ml) or no additions (C), were subjected to immunoprecipitation (IP) using anti-phosphotyrosine antibodies (anti-pY). Immunoprecipitates were then subjected to either SDS-PAGE and immunoblotting with anti-p85PAN polyclonal antibodies (top panel), or analysis of PI 3-kinase activity using phosphatidylinositol as substrate (bottom panel). The radio-labeled product, phosphatidylinositol 3′-phosphate (PIP) was separated from unincorporated radiolabel (Origin) using thin layer chromatography. Similar results were obtained in four independent experiments.
Figure 3
Figure 3
Effect of insulin and PDGF on the subcellular distribution of PI 3-kinase activity. Adipocytes were brought to basal conditions and incubated with insulin (I) or PDGF (P) or no additions (C). Cells were then homogenized and subjected to differential centrifugation to obtain fractions enriched in plasma membrane (PM), endoplasmic reticulum and endosomal markers (HDM), cytosol (CYT), and a high speed pellet fraction (HSP). Aliquots of each fraction (PM 25 μg; HSP, 100 μg; HDM, 75 μg; CYT 200 μg) representing on average 3/5, 2/5, 3/5, and 1/20 of these fractions in whole cells, respectively, were subjected to immunoprecipitation using anti-phosphotyrosine antibodies (anti-pY). Immunoprecipitates were then used for measurement of (A) PI 3-kinase activity, or (B) immunoreactive p85 using a polyclonal anti-p85PAN antibody. Quantitation of the distribution of PI 3-kinase activity among subcellular fractions is shown in (C). Total PI 3-kinase activity in each fraction from insulin (▪), versus PDGF (□), treated cells was calculated and expressed as percent of total after subtracting basal values. The mean values (± SEM) from three independent experiments are shown. PIP, phosphatidylinositol 3′-phosphate.
Figure 3
Figure 3
Effect of insulin and PDGF on the subcellular distribution of PI 3-kinase activity. Adipocytes were brought to basal conditions and incubated with insulin (I) or PDGF (P) or no additions (C). Cells were then homogenized and subjected to differential centrifugation to obtain fractions enriched in plasma membrane (PM), endoplasmic reticulum and endosomal markers (HDM), cytosol (CYT), and a high speed pellet fraction (HSP). Aliquots of each fraction (PM 25 μg; HSP, 100 μg; HDM, 75 μg; CYT 200 μg) representing on average 3/5, 2/5, 3/5, and 1/20 of these fractions in whole cells, respectively, were subjected to immunoprecipitation using anti-phosphotyrosine antibodies (anti-pY). Immunoprecipitates were then used for measurement of (A) PI 3-kinase activity, or (B) immunoreactive p85 using a polyclonal anti-p85PAN antibody. Quantitation of the distribution of PI 3-kinase activity among subcellular fractions is shown in (C). Total PI 3-kinase activity in each fraction from insulin (▪), versus PDGF (□), treated cells was calculated and expressed as percent of total after subtracting basal values. The mean values (± SEM) from three independent experiments are shown. PIP, phosphatidylinositol 3′-phosphate.
Figure 4
Figure 4
Effects of insulin versus PDGF on subcellular distribution of PI 3-kinase and tyrosyl-phosphorylated proteins in 3T3-L1 adipocytes. Adipocytes were brought to basal and incubated with insulin (I), or PDGF (P), or no additions (C). Cells were washed, homogenized and subcellular fractions prepared. Aliquots of each fraction (25 μg of protein) were analyzed by SDS-PAGE and immunoblotted with antibodies specific for (A) the p85 subunit of PI 3-kinase (anti-p85PAN) or (B) phosphotyrosine (anti-pY). There was no significant change in the distribution of p85 in the HDM with either insulin or PDGF (not shown). Tyrosyl phosphorylation could not be detected in the cytosol using this procedure (not shown). Results are representative of two experiments.
Figure 4
Figure 4
Effects of insulin versus PDGF on subcellular distribution of PI 3-kinase and tyrosyl-phosphorylated proteins in 3T3-L1 adipocytes. Adipocytes were brought to basal and incubated with insulin (I), or PDGF (P), or no additions (C). Cells were washed, homogenized and subcellular fractions prepared. Aliquots of each fraction (25 μg of protein) were analyzed by SDS-PAGE and immunoblotted with antibodies specific for (A) the p85 subunit of PI 3-kinase (anti-p85PAN) or (B) phosphotyrosine (anti-pY). There was no significant change in the distribution of p85 in the HDM with either insulin or PDGF (not shown). Tyrosyl phosphorylation could not be detected in the cytosol using this procedure (not shown). Results are representative of two experiments.
Figure 5
Figure 5
Subcellular distribution of IRS-1, Grb2, mSos, and Shc isoforms in adipocytes under basal and insulin-treated conditions. Adipocytes were brought to basal conditions and incubated in the absence (−) or presence(+) of insulin (1 μM) for 15 min at 37°C. Cells were washed, homogenized and subcellular fractions prepared. Aliquots of each fraction (25 μg of protein), the plasma membrane (PM), cytosol (CYT), high speed pellet (HSP), and high density microsomal (HDM) fractions, were analyzed by SDS-PAGE and immunoblotted with antibodies specific for IRS-1, Grb2, mSos, or Shc, respectively. The results shown are representative of two independent experiments.
Figure 6
Figure 6
Effects of nonionic detergents and high ionic strength on the high speed pellet (HSP) fraction from adipocytes. Adipocytes were brought to basal conditions and incubated in the absence or presence of insulin (1 μM), and then subjected to differential centrifugation to generate the HSP fraction. The HSP was incubated in buffer (Hepes, pH 7.4, 1 mM EDTA, 250 mM sucrose) or the same buffer containing 1% Triton X-100 (Tx-100), 60 mM β-octylglucoside (β-OG), 1.0 M NaCl, or 0.5 M NaCl, at 4°C for 1 h, and then subjected to centrifugation at 175,000 g. The resultant pellets were analysed by SDS-PAGE and immunoblotted with antibodies specific for IRS-1, phosphotyrosine (anti-pY), PI 3-kinase (anti-p85PAN), GLUT4, and γ-adaptin, respectively. The results are representative of three independent experiments.
Figure 7
Figure 7
Flotation analysis of the high speed pellet (HSP) fraction prepared from adipocytes. The HSP subcellular fraction from untreated (A) or insulin-treated (B and C) adipocytes was prepared and resuspended in buffer (Hepes, pH 7.4, 1 mM EDTA) containing 60% sucrose in a final volume of 1 ml. This fraction was successively overlaid with buffer (1 ml) containing 50, 30, and 10% sucrose and 400 μl of buffer containing 5% sucrose. Sucrose gradients were then centrifuged at 90,000 g for 18 h. Fractions (400 μl) were collected from the bottom (1–11) of each gradient by gravity and the pellet (P) was solubilized in 400 μl of buffer. Aliquots of each fraction were used for measurement of total protein content or immunoblotted with antibodies specific for IRS-1, phosphotyrosine (anti-pY) PI 3-kinase (anti-p85PAN) or GLUT4. (C) Aliquots of each fraction (100 μl) were immunoprecipitated with anti-phosphotyrosine antibodies and assayed for PI 3-kinase activity. Radio-labeled product, PIP, present in each immunoprecipitate was resolved by TLC (inset), excised, and quantitated by scintillation counting. The result shown depicts the percentage of PI 3-kinase activity immunoprecipitated from the pellet (P) and fractions (1–7), relative to total activity present in the entire gradient. Immunoprecipitates of fractions 8–11 contained <1% of total PI 3-kinase activity present in the entire gradient, and is not shown. Results are representative of two independent experiments.
Figure 7
Figure 7
Flotation analysis of the high speed pellet (HSP) fraction prepared from adipocytes. The HSP subcellular fraction from untreated (A) or insulin-treated (B and C) adipocytes was prepared and resuspended in buffer (Hepes, pH 7.4, 1 mM EDTA) containing 60% sucrose in a final volume of 1 ml. This fraction was successively overlaid with buffer (1 ml) containing 50, 30, and 10% sucrose and 400 μl of buffer containing 5% sucrose. Sucrose gradients were then centrifuged at 90,000 g for 18 h. Fractions (400 μl) were collected from the bottom (1–11) of each gradient by gravity and the pellet (P) was solubilized in 400 μl of buffer. Aliquots of each fraction were used for measurement of total protein content or immunoblotted with antibodies specific for IRS-1, phosphotyrosine (anti-pY) PI 3-kinase (anti-p85PAN) or GLUT4. (C) Aliquots of each fraction (100 μl) were immunoprecipitated with anti-phosphotyrosine antibodies and assayed for PI 3-kinase activity. Radio-labeled product, PIP, present in each immunoprecipitate was resolved by TLC (inset), excised, and quantitated by scintillation counting. The result shown depicts the percentage of PI 3-kinase activity immunoprecipitated from the pellet (P) and fractions (1–7), relative to total activity present in the entire gradient. Immunoprecipitates of fractions 8–11 contained <1% of total PI 3-kinase activity present in the entire gradient, and is not shown. Results are representative of two independent experiments.
Figure 8
Figure 8
Resedimentation of IRS-1 and PI 3-kinase subsequent to sucrose gradient centrifugation. The HSP fraction from insulin-treated cells was subjected to flotation analysis as described in Fig. 7. Fractions 1 (F1) and 2 (F2) comprising Peak 1 from this gradient were made isotonic with buffer (20 mM Hepes, pH 7.4, 1 mM EDTA), and centrifuged at 175,000 g for 1 h 15 min. The corresponding pellets (P1 and P2), together with an equivalent amount of the starting fractions (F1 and F2), were subjected to SDS-PAGE and immunoblotted with specific antibodies for IRS-1 and PI 3-kinase (anti-p85PAN). Identical results were also obtained using HSP isolated from basal cells and are not shown.
Figure 9
Figure 9
Sedimentation velocity analysis of the HSP from 3T3-L1 adipocytes. The HSP fraction obtained from basal (A), or insulin-treated adipocytes (B), was resuspended in buffer (20 mM Hepes, pH 7.4, 1 mM EDTA, 200 μl) containing 5% sucrose, and overlaid on to a 5–30% continuous sucrose gradient. Gradients were centrifuged at 90,000 g for 90 min, and fractions (400 μl) collected from the bottom (1–11) of each gradient by gravity. Aliquots of each fraction were assayed for protein content, or resolved by SDS-PAGE (30 μl) and subjected to immunoblotting with antibodies specific for IRS-1, phosphotyrosine (anti-pY), PI 3-kinase (anti-p85PAN), and GLUT4. The results are representative of two independent experiments.
Figure 9
Figure 9
Sedimentation velocity analysis of the HSP from 3T3-L1 adipocytes. The HSP fraction obtained from basal (A), or insulin-treated adipocytes (B), was resuspended in buffer (20 mM Hepes, pH 7.4, 1 mM EDTA, 200 μl) containing 5% sucrose, and overlaid on to a 5–30% continuous sucrose gradient. Gradients were centrifuged at 90,000 g for 90 min, and fractions (400 μl) collected from the bottom (1–11) of each gradient by gravity. Aliquots of each fraction were assayed for protein content, or resolved by SDS-PAGE (30 μl) and subjected to immunoblotting with antibodies specific for IRS-1, phosphotyrosine (anti-pY), PI 3-kinase (anti-p85PAN), and GLUT4. The results are representative of two independent experiments.
Figure 11
Figure 11
Retention of IRS-1 and PI 3-kinase within permeabilized CHO cells. CHO cells overexpressing IR and IRS-1 were brought to basal conditions and then incubated in the absence (−) or presence (+) of Streptolysin-O (SLO) to perforate the cells. Cells were washed, homogenized, and subjected to differential centrifugation to obtain the high speed pellet (HSP) and cytosolic (CYT) fractions. Aliquots of each fraction (15 μg of protein) were subjected to SDS-PAGE and immunoblotted with antibodies specific for IRS-1 and PI 3-kinase (anti-p85PAN).
Figure 10
Figure 10
Sedimentation velocity analysis of the HSP from CHO/IR/IRS–1 cells. The HSP fraction obtained from basal (A), or insulin-treated (B), CHO cells overexpressing the insulin receptor (IR) and IRS-1, was resuspended in buffer (20 mM Hepes, pH 7.4, 1 mM EDTA, 200 μl) containing 5% sucrose, and overlaid on to a 5–30% continuous sucrose gradient. Gradients were centrifuged at 90,000 g for 90 min, and fractions (400 μl) collected from the bottom (1–11) of each gradient by gravity. Aliquots of each fraction were assayed for protein content, or resolved by SDS-PAGE (30 μl) and subjected to immunoblotting with antibodies specific for IRS-1, phosphotyrosine (anti-pY), and PI 3-kinase (anti-p85PAN).
Figure 10
Figure 10
Sedimentation velocity analysis of the HSP from CHO/IR/IRS–1 cells. The HSP fraction obtained from basal (A), or insulin-treated (B), CHO cells overexpressing the insulin receptor (IR) and IRS-1, was resuspended in buffer (20 mM Hepes, pH 7.4, 1 mM EDTA, 200 μl) containing 5% sucrose, and overlaid on to a 5–30% continuous sucrose gradient. Gradients were centrifuged at 90,000 g for 90 min, and fractions (400 μl) collected from the bottom (1–11) of each gradient by gravity. Aliquots of each fraction were assayed for protein content, or resolved by SDS-PAGE (30 μl) and subjected to immunoblotting with antibodies specific for IRS-1, phosphotyrosine (anti-pY), and PI 3-kinase (anti-p85PAN).
Figure 12
Figure 12
Identification of bundles of filamentous networks in HSP fraction, and the detergent insoluble component of this fraction, from adipocytes. The HSP fraction from basal adipocytes was subjected to velocity sedimentation analysis through sucrose gradients as described in Fig. 9. Fractions enriched in GLUT4 (fractions 5–7) or IRS-1/PI 3-kinase (fractions 8–10) were pooled and made isotonic by diluting in buffer (20 mM Hepes, pH 7.4, 1 mM EDTA) and subjected to high speed centrifugation. The resultant pellet from this step was resuspended in PBS and subsequently fixed in 2% paraformaldehyde/PBS, and subjected to electron microscopy analysis. Electron micrographs of paraformaldehyde-fixed samples obtained from gradient fractions enriched in (A) IRS-1/PI 3-kinase and (B) GLUT4 are shown. In separate experiments, (C) the Tx-100–insoluble component of the HSP fraction was prepared and fixed in 2% paraformaldehyde/PBS and subjected to electron microscopy analysis. Bars, 200 nm.

References

    1. Baltensperger K, Kozma LM, Cherniack AD, Klarlund JK, Chawla A, Banerjee U, Czech MP. Binding of the Ras activator son of sevenless to insulin receptor substrate-1 signaling complexes. Science. 1993;260:1950–1952. - PubMed
    1. Brown DA, Rose JK. Sorting of GPI-anchored proteins to glycolipid-enriched membrane subdomains during transport to the apical cell surface. Cell. 1992;68:533–544. - PubMed
    1. Cambier JC, Campbell KS. Membrane immunoglobulin and its accomplices: new lessons from an old receptor. FASEB (Fed Am Soc Exp Biol) J. 1992;6:3207–3217. - PubMed
    1. Conricode KM. Involvement of phosphatidylinositol 3-kinase in stimulation of glucose transport by growth factors in 3T3-L1 adipocytes. Biochem Mol Biol Int. 1995;36:835–843. - PubMed
    1. Cormont M, Van Obbergen E, Zerial M, Le Marchand-Brustel Y. Insulin induces a change in rab5 subcellular localization in adipocytes independently of phosphatidylinositol 3-kinase activation. Endocrinology. 1996;137:3408–3415. - PubMed

Publication types

MeSH terms

Substances