. 1998 Mar 9;140(5):1227-40.
doi: 10.1083/jcb.140.5.1227.

Cytoplasmic regulation of the movement of E-cadherin on the free cell surface as studied by optical tweezers and single particle tracking: corralling and tethering by the membrane skeleton

Affiliations

Cytoplasmic regulation of the movement of E-cadherin on the free cell surface as studied by optical tweezers and single particle tracking: corralling and tethering by the membrane skeleton

Y Sako et al. J Cell Biol. .

Abstract

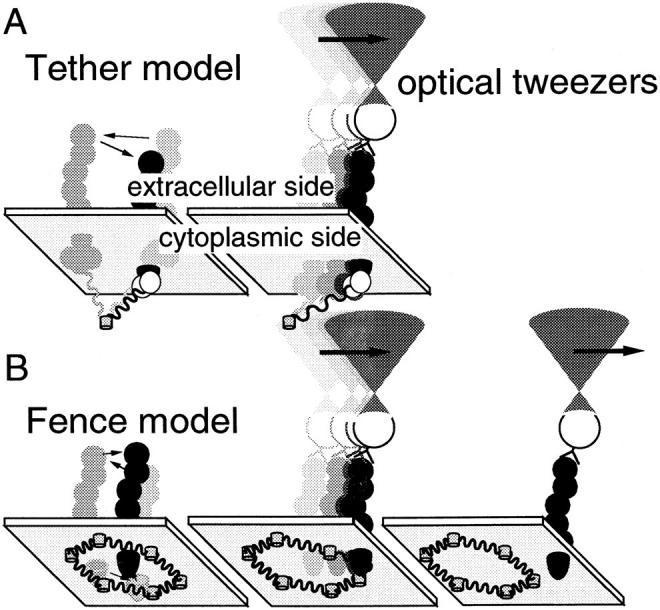
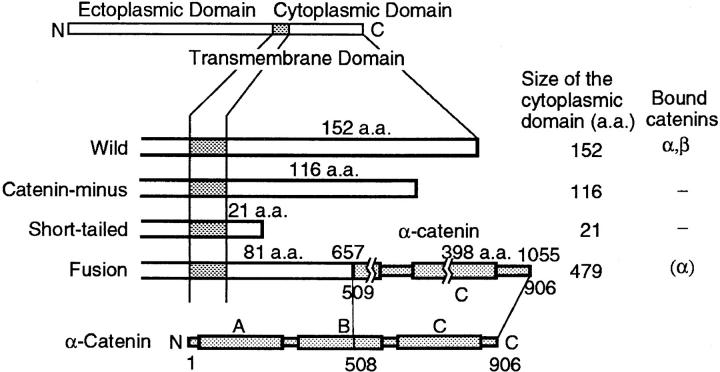
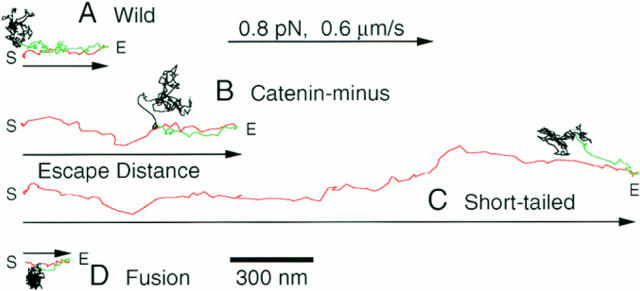
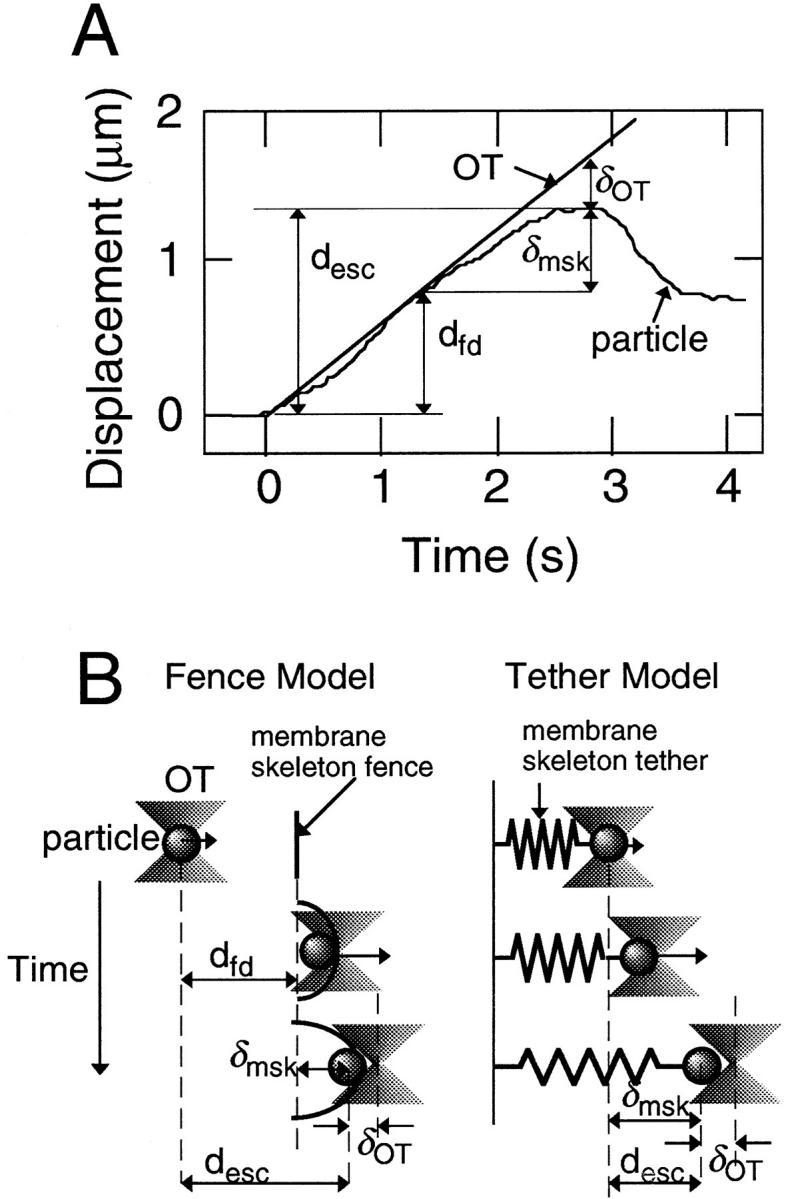
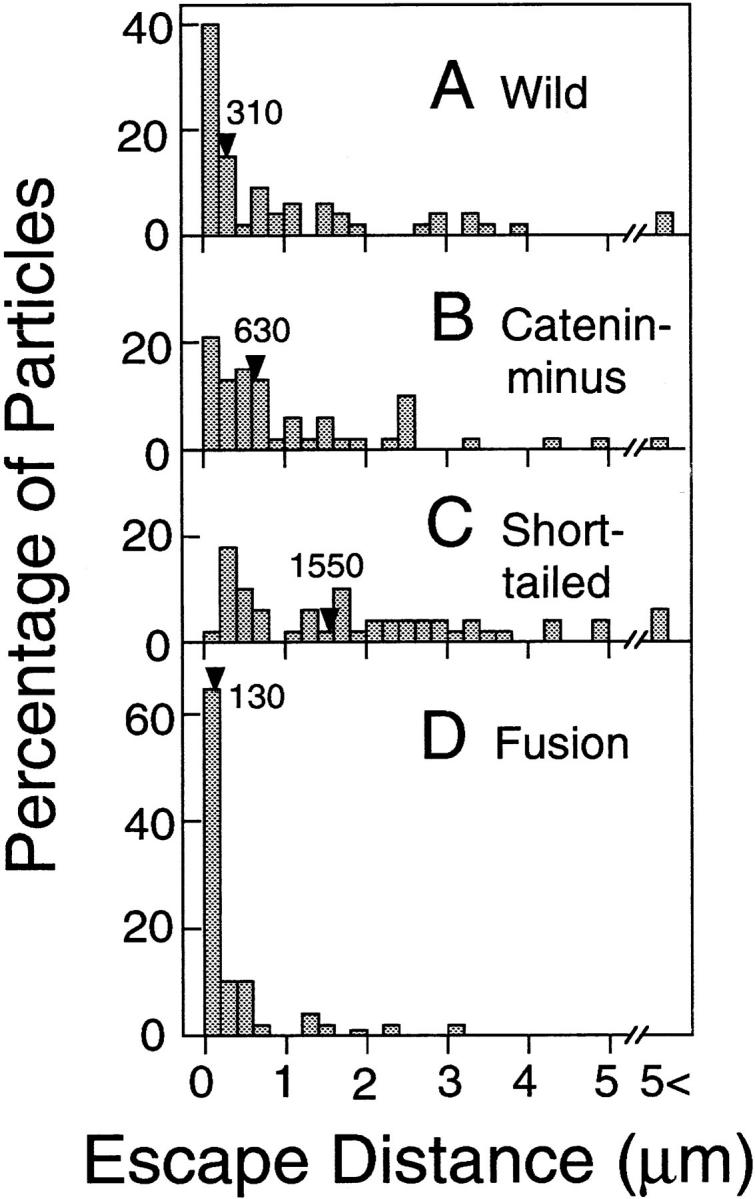
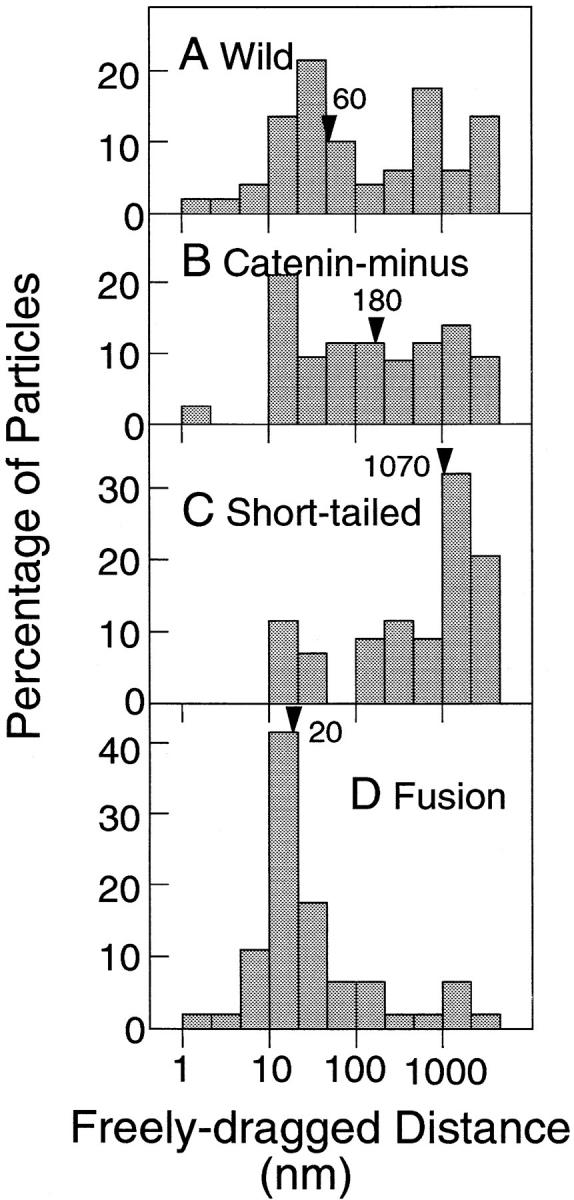
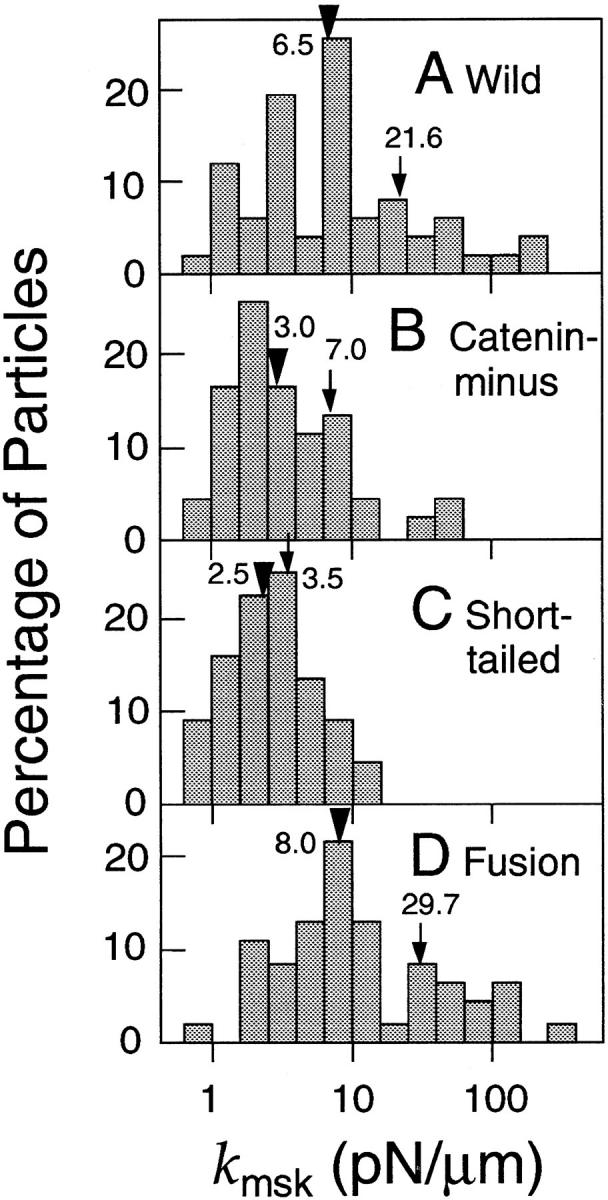
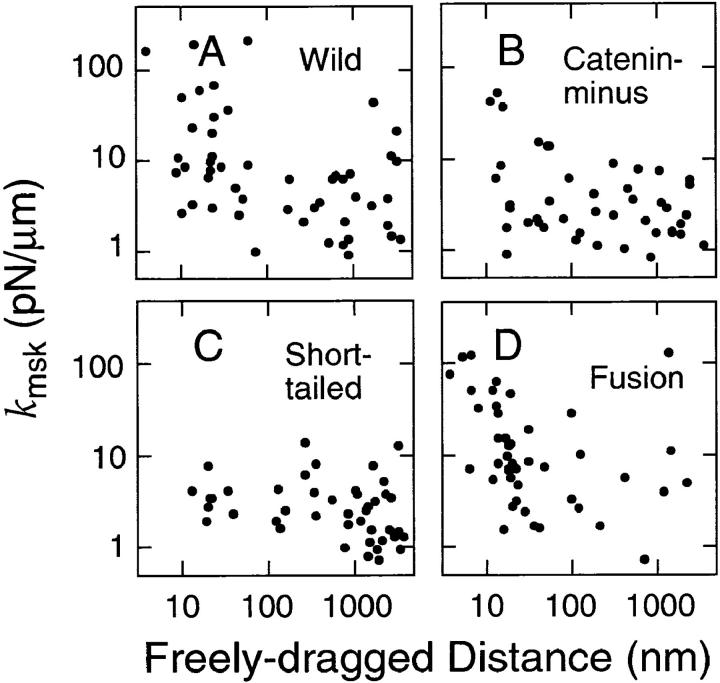
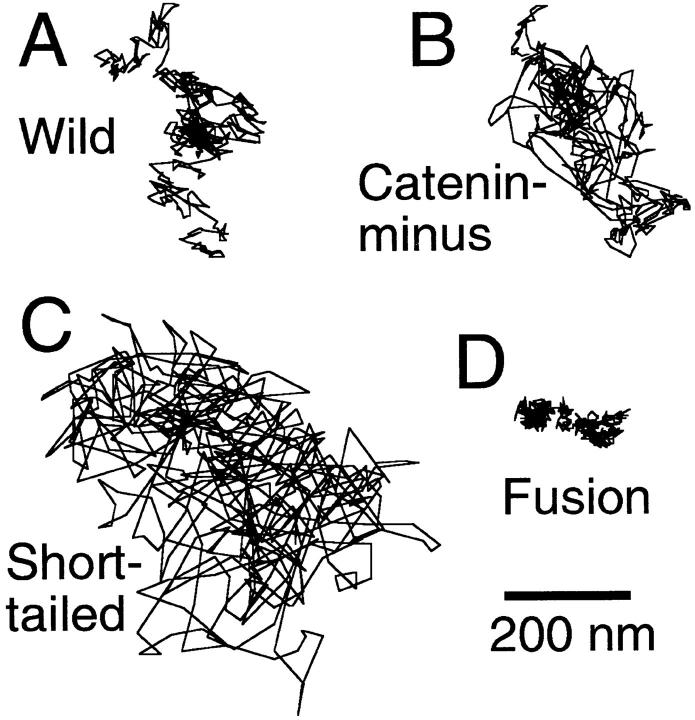
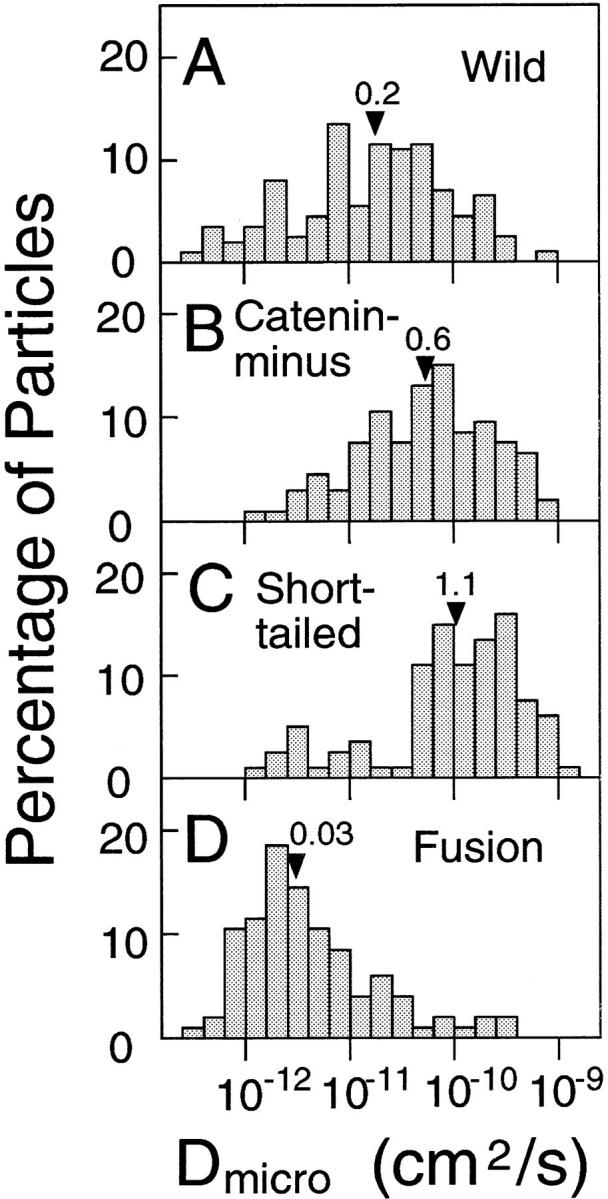
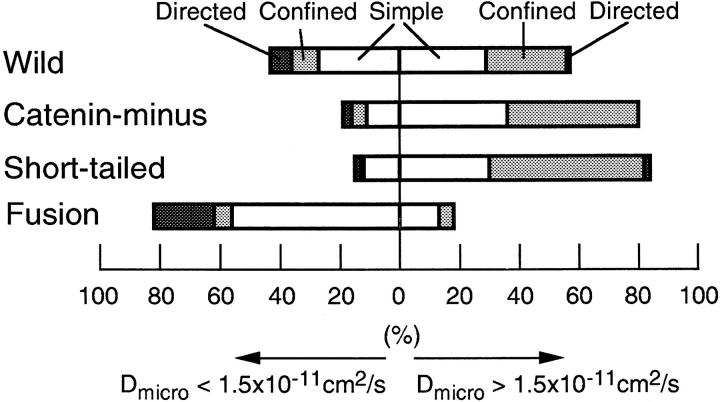
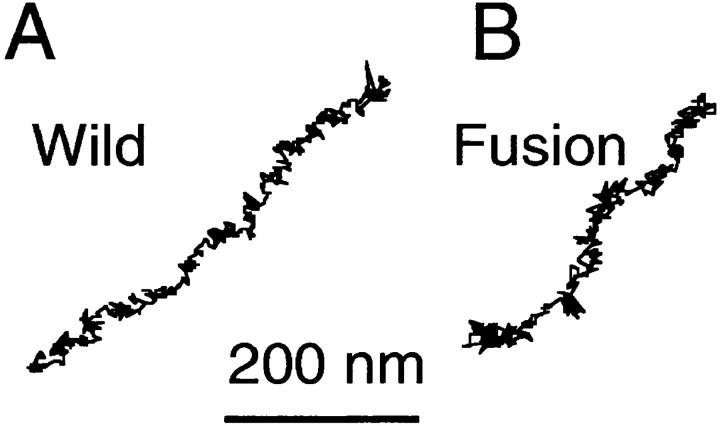
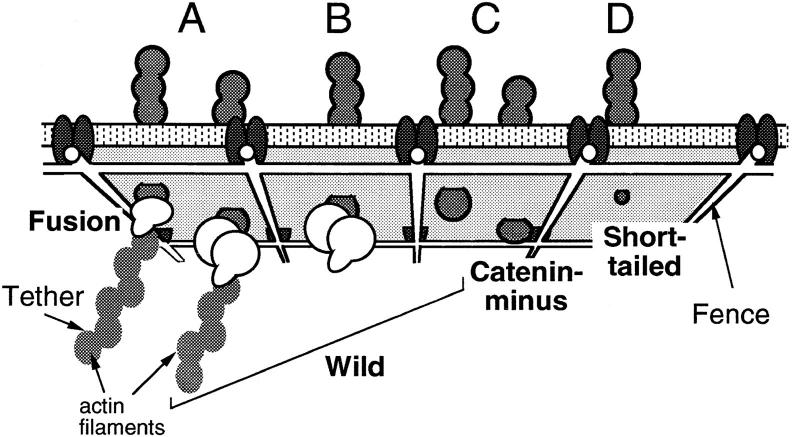
The translational movement of E-cadherin, a calcium-dependent cell-cell adhesion molecule in the plasma membrane in epithelial cells, and the mechanism of its regulation were studied using single particle tracking (SPT) and optical tweezers (OT). The wild type (Wild) and three types of artificial cytoplasmic mutants of E-cadherin were expressed in L-cells, and their movements were compared. Two mutants were E-cadherins that had deletions in the COOH terminus and lost the catenin-binding site(s) in the COOH terminus, with remaining 116 and 21 amino acids in the cytoplasmic domain (versus 152 amino acids for Wild); these are called Catenin-minus and Short-tailed in this paper, respectively. The third mutant, called Fusion, is a fusion protein between E-cadherin without the catenin-binding site and alpha-catenin without its NH2-terminal half. These cadherins were labeled with 40-nm phi colloidal gold or 210-nm phi latex particles via a monoclonal antibody to the extracellular domain of E-cadherin for SPT or OT experiments, respectively. E-cadherin on the dorsal cell surface (outside the cell-cell contact region) was investigated. Catenin-minus and Short-tailed could be dragged an average of 1.1 and 1.8 micron by OT (trapping force of 0.8 pN), and exhibited average microscopic diffusion coefficients (Dmicro) of 1.2 x 10(-10) and 2.1 x 10(-10) cm2/s, respectively. Approximately 40% of Wild, Catenin-minus, and Short-tailed exhibited confined-type diffusion. The confinement area was 0.13 micron2 for Wild and Catenin-minus, while that for Short-tailed was greater by a factor of four. In contrast, Fusion could be dragged an average of only 140 nm by OT. Average Dmicro for Fusion measured by SPT was small (0.2 x 10(-10) cm2/s). These results suggest that Fusion was bound to the cytoskeleton. Wild consists of two populations; about half behaves like Catenin- minus, and the other half behaves like Fusion. It is concluded that the movements of the wild-type E-cadherin in the plasma membrane are regulated via the cytoplasmic domain by (a) tethering to actin filaments through catenin(s) (like Fusion) and (b) a corralling effect of the network of the membrane skeleton (like Catenin-minus). The effective spring constants of the membrane skeleton that contribute to the tethering and corralling effects as measured by the dragging experiments were 30 and 5 pN/micron, respectively, indicating a difference in the skeletal structures that produce these two effects.


Figures

Figure 1
Figure 1
A tether model (A) and a fence model (B) proposed as mechanisms for the regulation of lateral movements of E-cadherin (Sako and Kusumi, 1995). These models are shown together with the optical tweezers experiments which may make it possible to differentiate and characterize these two mechanisms. (A) E-cadherin tethered to a cytoskeletal filament can be dragged only the length the filament is stretched, with a force of ≈1 pN or less. (B) An E-cadherin molecule free from tethering may be temporarily trapped within a compartment enclosed by the membrane skeleton fence. The particle–protein complex can pass across the fence if the dragging force by OT is high enough. For transferrin receptor in the plasma membrane of NRK cells, the force needed to pass across the fence is 0.05–0.1 pN (Sako and Kusumi, 1995).
Figure 2
Figure 2
Structures of the wild-type E-cadherin and its artificial mutants used in this study. E-cadherin has a single transmembrane domain. Binding site(s) for catenins exists in the sequence of 7–72 aa from the COOH terminus (Nagafuchi and Takeichi, 1989; Ozawa et al., 1990). Wild type (Wild) contains 152 aa in the cytoplasmic domain. Catenin-minus and Short-tailed have deletions of 36 and 131 aa from the COOH terminus, leaving 116 and 21 aa, respectively, in the cytoplasmic domain. These molecules have lost binding sites for catenin(s). Fusion is a fusion protein of E-cadherin that lacks 72 aa at the COOH terminus fused with the COOH-terminal 508–906 aa of α-catenin. Fusion does not have a catenin binding site. Rectangles (A, B, and C) in the molecular structures of α-catenin and Fusion indicate regions homologous to vinculin (A, talin binding domain; B, function unknown; C, paxillin/vinculin binding domain (Nagafuchi et al., 1991).
Figure 3
Figure 3
Indirect immunofluorescence staining of E-cadherin on the surface of cells transfected with E-cadherin cDNAs. Cells before (A–D) and after (B–D) incubation with ECCD-2–G40 were fixed with cold methanol, and E-cadherin on the cell surface was stained with ECCD-2 and FITC-labeled anti–rat IgG. Images were obtained by a confocal laser scanning microscopy, with a focal plane at about the height of the dorsal free cell surface near the peripheries of the cell. Staining on the plasma membrane over the nucleus was not observed because it is out of focus. A and E, Wild; B and F, Catenin-minus; C and G, Short-tailed; and D and H, Fusion. Bar, 50 μm.
Figure 4
Figure 4
Trajectories of particle–cadherin complexes dragged by OT. E-cadherin and its mutants in the plasma membrane of living cells were labeled with 210-nm latex particles and dragged by OT. Trajectories of dragged particles for which the escape distance was the median value for each type of molecule are shown. The particles were dragged up to 5 μm by moving the laser beam of the OT at a rate of 0.6 μm/s. The maximal trapping force was 0.8 pN. The particles to be dragged were selected randomly on the free cell surface outside the cell–cell contact region. The directions for dragging were also randomly selected. In this figure, trajectories are arranged so that they start from the left and dragging proceeds to the right. Dragging was started at the point S, and the dragged portion is shown in red. The distance from the start position to the farthest point the particle reached by dragging (E, escape point) is called the escape distance (arrows). Many E-cadherin molecules showed rebound motion toward the initial positions after they escaped from the OT. The rebound is shown in green. After rebound motion, particles resumed random movements (black).
Figure 5
Figure 5
(A) The time course of a representative dragging experiment. The displacement of the particle and the center of the OT are plotted against time. d esc represents the escape distance, and δOT is the distance between the particle and the center of the OT at the escape point. Other parameters are explained in B. See the text for details. (B) Schematic drawings of the dragging experiments showing the interaction between the membrane protein and the membrane skeleton for the fence and tether models. d fd represents the freely dragged distance, and δmsk represents the strain of the membrane skeleton/cytoskeleton at the escape point. See the text for details.
Figure 6
Figure 6
Distributions of the escape distances. The median values are indicated by arrowheads. The numbers of particles examined were 55 (A, Wild), 49 (B, Catenin- minus), 54 (C, Short-tailed), and 49 (D, Fusion).
Figure 7
Figure 7
Distributions of the freely dragged distances. The median values are indicated by arrowheads. The numbers of particles examined were 53 (A, Wild), 48 (B, Catenin-minus), 51 (C, Short-tailed), and 49 (D, Fusion). The numbers of particles are different from those in Fig. 6, since the freely dragged distance cannot be determined in cases where particles are dragged to the end (5 μm) without any detectable lag. Note that the abscissa is shown on a log scale.
Figure 8
Figure 8
Distributions of the effective spring constant (k msk) of the portions of the membrane skeleton/cytoskeleton that are involved in corralling or tethering E-cadherin molecules. The mean and median values are indicated by arrows and arrowheads, respectively. Note that k msk is plotted on a log scale.
Figure 9
Figure 9
k msk (effective spring constant) plotted against the freely dragged distance (d fd) for individual particles. Spring constants were calculated from the maximal trapping force of the OT (0.8 pN) and the strain (δmsk; see Fig. 5) of the membrane skeleton/cytoskeleton. Note that both k msk and the freely dragged distance are plotted on a log scale.
Figure 10
Figure 10
SPT trajectories of E-cadherins recorded for 16.7 s (500 video frames). Trajectories for which the 5-s MSD was the median value for each type of E-cadherin molecule are shown.
Figure 11
Figure 11
Distributions of D micro. The median values are indicated by arrowheads (× 10−10 cm2/s).
Figure 12
Figure 12
Classification of trajectories into simple Brownian, confined, and directed movement modes in a time window of 5 s. The results are shown separately for D micro values greater and smaller than 1.5 × 10⁻¹¹ cm2/s.
Figure 13
Figure 13
Typical trajectories of Wild (A) and Fusion (B) classified as directed movement. Recording time was 16.7 s (500 video frames).
Figure 14
Figure 14
Models of the mechanisms for the regulation of the movement of E-cadherins in the plasma membrane. Movements are regulated through the cytoplasmic domain of E-cadherin by the tethering and corralling effects of the membrane skeleton/cytoskeleton network. Most of the Fusion molecules are tethered to the cytoskeleton through the COOH-terminal domain of α-catenin (A, left). Catenin-minus and Short-tailed are free from tethering, but exhibit temporarily confined diffusion within submicrometer-scale membrane compartments bounded by the membrane skeleton (C, right and D, respectively). A decrease in the size of the cytoplasmic domain increases the probability that cadherin will pass the fence (D). Wild has two populations; about half is tethered to the cytoskeleton (A, right), whereas the other half is corralled in the membrane skeletal mesh (B and C, left).

Similar articles

Cited by

References

    1. Ashkin A, Dziedzic JM, Bjorkholm JE, Chu S. Observation of a single-beam gradient force optical trap for dielectric particles. Optics Lett. 1986;11:288–290. - PubMed
    1. Ashkin A, Dziedzic JM, Yamane T. Optical trapping and manipulation of single cells using infrared-laser beams. Nature. 1987;330:769–771. - PubMed
    1. Bacallao R, Antony C, Dotti C, Karsenti E, Stelzer EH, Simons K. The subcellular organization of Madin-Darby canine kidney cells during the formation of a polarized epithelium. J Cell Biol. 1989;109:2817–2832. - PMC - PubMed
    1. Balsamo J, Lilien J. N-cadherin is stably associated with and is an acceptor for a cell surface N-acetylgalactosaminylphosphotransferase. J Biol Chem. 1990;265:2923–2928. - PubMed
    1. Berg, H.C. 1983. Random Walks in Biology. Princeton University Press, Princeton, New Jersey.