. 1998 Feb 1;116(2):547-57.
doi: 10.1104/pp.116.2.547.

Transport, Compartmentation, and Metabolism of Homoserine in Higher Plant Cells. Carbon-13- and phosphorus-31-nuclear magnetic resonance studies Carbon-13- and Phosphorus-31-Nuclear Magnetic Resonance Studies

Affiliations

Transport, Compartmentation, and Metabolism of Homoserine in Higher Plant Cells. Carbon-13- and phosphorus-31-nuclear magnetic resonance studies Carbon-13- and Phosphorus-31-Nuclear Magnetic Resonance Studies

S Aubert et al. Plant Physiol. .

Abstract

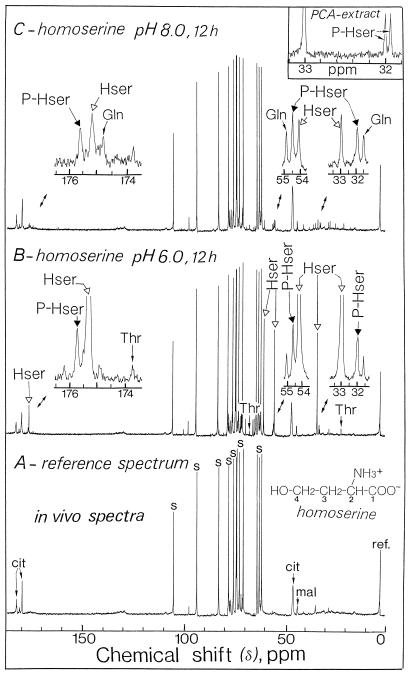
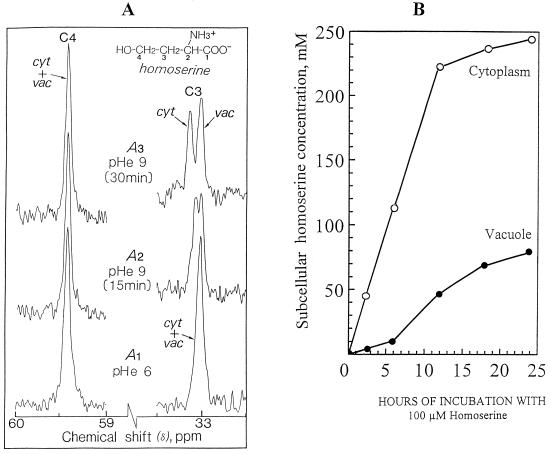
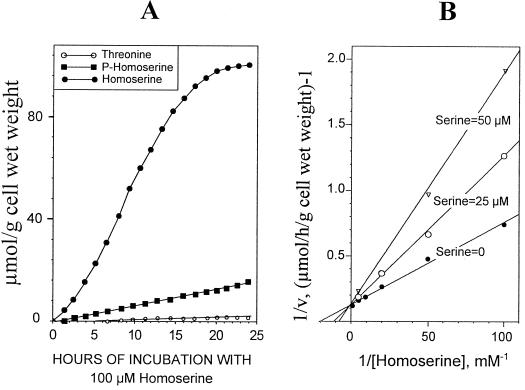
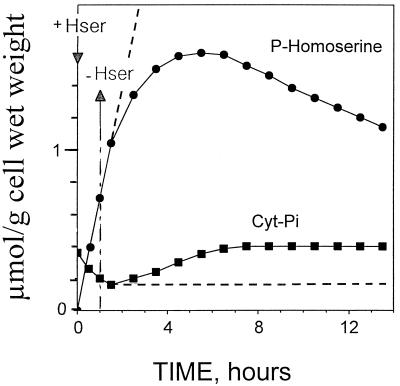
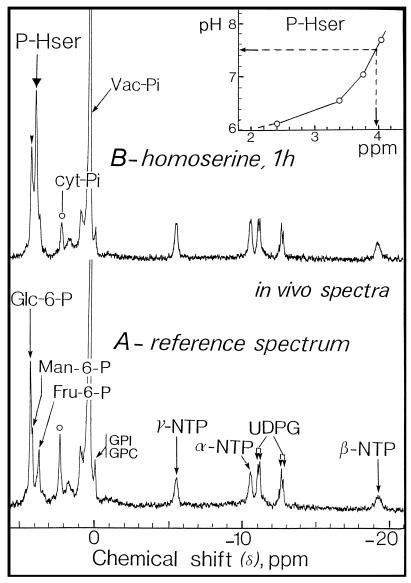
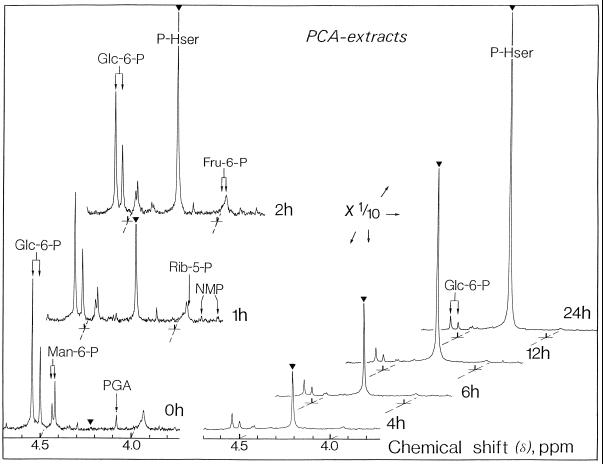
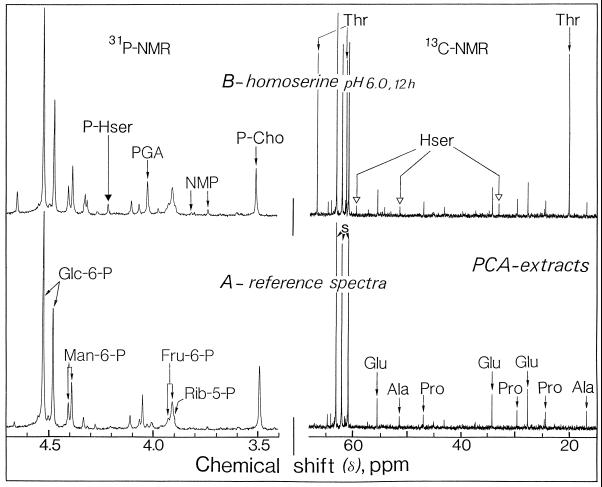
The transport, compartmentation, and metabolism of homoserine was characterized in two strains of meristematic higher plant cells, the dicotyledonous sycamore (Acer pseudoplatanus) and the monocotyledonous weed Echinochloa colonum. Homoserine is an intermediate in the synthesis of the aspartate-derived amino acids methionine, threonine (Thr), and isoleucine. Using 13C-nuclear magnetic resonance, we showed that homoserine actively entered the cells via a high-affinity proton-symport carrier (Km approximately 50-60 mum) at the maximum rate of 8 +/- 0.5 mumol h-1 g-1 cell wet weight, and in competition with serine or Thr. We could visualize the compartmentation of homoserine, and observed that it accumulated at a concentration 4 to 5 times higher in the cytoplasm than in the large vacuolar compartment. 31P-nuclear magnetic resonance permitted us to analyze the phosphorylation of homoserine. When sycamore cells were incubated with 100 mum homoserine, phosphohomoserine steadily accumulated in the cytoplasmic compartment over 24 h at the constant rate of 0.7 mumol h-1 g-1 cell wet weight, indicating that homoserine kinase was not inhibited in vivo by its product, phosphohomoserine. The rate of metabolism of phosphohomoserine was much lower (0.06 mumol h-1 g-1 cell wet weight) and essentially sustained Thr accumulation. Similarly, homoserine was actively incorporated by E. colonum cells. However, in contrast to what was seen in sycamore cells, large accumulations of Thr were observed, whereas the intracellular concentration of homoserine remained low, and phosphohomoserine did not accumulate. These differences with sycamore cells were attributed to the presence of a higher Thr synthase activity in this strain of monocot cells.


Figures

Figure 1
Figure 1
Representative in vivo 13C-NMR spectra obtained from sycamore cells. The spectra, recorded at 20°C, are the result of 900 transients (1 h). A, Control cells at pH 6.0; B, cells incubated for 12 h with 100 μm homoserine at pH 6.0; C, cells incubated for 12 h with 100 μm homoserine at pH 8.0. Note that the C1 resonance of homoserine (carboxyl group) is smaller than those of C2 to C4. This is attributable to the fact that the relaxation time of the carboxyl groups exceeds the duration of induction decays, resulting in a saturation of the signal. In addition, the C1 peak is broadened because of interaction of the carboxyl group with divalent cations. cit, Citrate; Hser, homoserine; mal, malate; PCA, perchloric acid; P-Hser, phosphohomoserine; ref., reference signal; and s, Suc.
Figure 2
Figure 2
Compartmentation of homoserine between cytoplasm and vacuole, determined by in vivo 13C-NMR after rapid alkalization. Sycamore cells were incubated with 100 μm homoserine for 12 h at pH 6.0 as in Figure 1. Magnifications of the resonance peaks of C3 and C4 of homoserine are shown (A). Each spectrum is the result of 225 transients (15 min). A1, Spectrum obtained before NH4+ addition, pH 6.0; A2 and A3, spectra obtained 15 and 30 min, respectively, after alkalization of the perfusion medium (pHe) from 6.0 to 9.0 in the presence of 0.5 mm NH4+. Under these conditions C4 from homoserine was not affected by pH, whereas C3 was split into two distinct peaks corresponding to the vacuolar and cytoplasmic pools of homoserine. B, Curves show kinetics of accumulation of homoserine in the cytoplasm and in the vacuole. Each time point was obtained from a separate set of cells incubated with 100 μm homoserine at pHe 6.0 during various times and then subjected to NH4+ addition. cyt, Cytoplasm; vac, vacuole.
Figure 3
Figure 3
Characterization of homoserine transport in sycamore cells. A, Evolution of intracellular homoserine, phosphohomoserine, and Thr in sycamore cells incubated with 100 μm homoserine at pH 6.0, determined from in vivo 13C-NMR spectra. The values, expressed as μmol g−1 cell wet weight, are from a representative experiment chosen from a series of five. B, Double-reciprocal plot of the initial rates of homoserine uptake (rate of homoserine accumulation plus the rate of phosphohomoserine accumulation) in the absence or presence of Ser (25 and 50 μm).
Figure 6
Figure 6
Evolution of cytoplasmic Pi (Cyt-Pi) and phosphohomoserine in sycamore cells. In vivo 31P-NMR was used to determine Cyt-Pi and phosphohomoserine. At time 0, 100 μm homoserine was added to the perfusion medium at pH 6.0. After 1 h, cells were maintained in the medium (dashed lines) or perfused with a culture medium devoid of homoserine to remove extracellular homoserine (unbroken lines). The values, expressed as μmol g−1 cell wet weight, are from a representative experiment chosen from a series of five. Hser, Homoserine.
Figure 4
Figure 4
Representative in vivo 31P-NMR spectra of sycamore cells. The spectra, recorded at 20°C, are the result of 6000 transients (1 h). A, Control cells; B, cells incubated with 100 μm homoserine for 1 h at pH 6.0. cyt, Cytoplasm; GPC, glycerylphosphorylcholine; GPI, glycerylphosphorylinositol; NTP, nucleoside triphosphate; P-Hser, phosphohomoserine; UDPG, UDP-α-d-Glc; and Vac, vacuole.
Figure 5
Figure 5
Representative in vitro 31P-NMR spectra (perchloric acid extracts, expanded scale from 3.7 to 4.7 ppm) of sycamore cells. Cells were incubated at various times with 100 μm homoserine at pH 6.0. Perchloric acid extracts were prepared according to the procedure described in Methods. The spectra, recorded at 20°C, are the result of 1024 transients (1 h). NMP, Nucleoside monophosphate; PCA, perchloric acid; PGA, 3-phosphoglycerate; and P-Hser, phosphohomoserine.
Figure 7
Figure 7
Representative in vitro 13C- (expanded scale from 15 to 65 ppm) and 31P- (expanded scale from 3.4 to 4.7 ppm) NMR spectra from E. colonum cells. A, Control cells; B, cells incubated for 12 h with 100 μm homoserine at pH 6.0. Hser, Homoserine; NMP, nucleoside monophosphate; PCA, perchloric acid; P-Cho, phosphorylcholine; PGA, 3-phosphoglycerate; P-Hser, phosphohomoserine; and s, Suc.

References

    1. Aubert S, Alban C, Bligny R, Douce R. Induction of β-methylcrotonyl-coenzyme A carboxylase in higher plant cells during carbohydrate starvation: evidence for a role of MCCase in leucine catabolism. FEBS Lett. 1996a;383:175–180. - PubMed
    1. Aubert S, Bligny R, Day DA, Whelan J, Douce R. Induction of alternative oxidase synthesis by herbicides inhibiting branched-chain amino acid synthesis. Plant J. 1997;11:649–657.
    1. Aubert S, Bligny R, Douce R (1996b) NMR studies of metabolism in cell suspensions and tissue cultures. In Y Shachar-Hill, P Pfeffer, eds, Nuclear Magnetic Resonance in Plant Physiology. American Society of Plant Physiologists, Rockville, MD, pp 109–154
    1. Aubert S, Gout E, Bligny R, Mazars-Marty D, Barrieu F, Alabouvette J, Marty F, Douce R. Ultrastructural and biochemical characterization of autophagy in higher plant cells submitted to carbon deprivation: control by the supply of mitochondria with respiratory substrates. J Cell Biol. 1996c;133:1251–1263. - PMC - PubMed
    1. Bligny R, Gardestrom P, Roby C, Douce R. 31P NMR studies of spinach leaves and their chloroplasts. J Biol Chem. 1990;265:1319–1326. - PubMed

LinkOut - more resources