. 1998 Feb 1;116(2):637-41.
doi: 10.1104/pp.116.2.637.

Induction and Regulation of Expression of a Low-CO2-Induced Mitochondrial Carbonic Anhydrase in Chlamydomonas reinhardtii

Affiliations

Induction and Regulation of Expression of a Low-CO2-Induced Mitochondrial Carbonic Anhydrase in Chlamydomonas reinhardtii

M Eriksson et al. Plant Physiol. .

Abstract

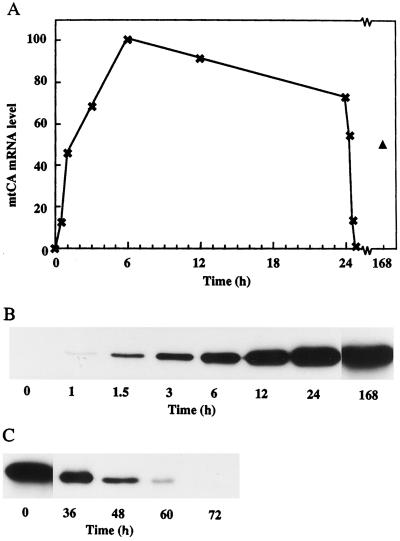
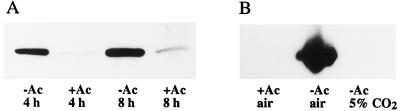
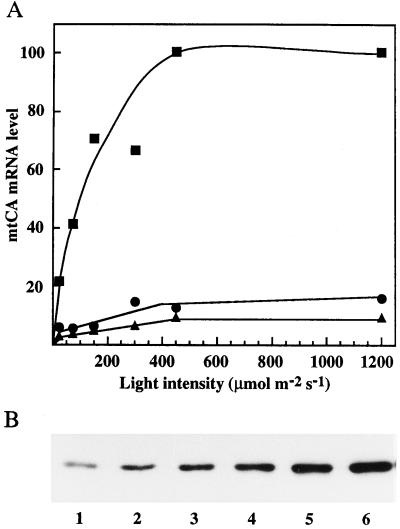
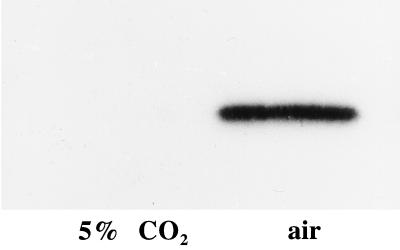
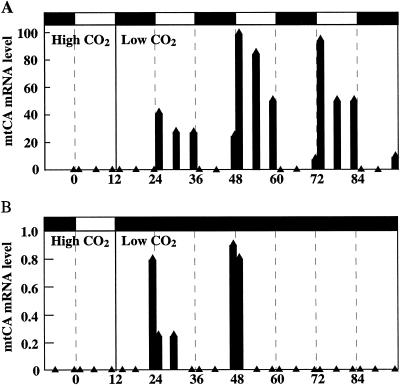
The time course of and the influence of light intensity and light quality on the induction of a mitochondrial carbonic anhydrase (CA) in the unicellular green alga Chlamydomonas reinhardtii was characterized using western and northern blots. This CA was expressed only under low-CO2 conditions (ambient air). In asynchronously grown cells, the mRNA was detected 15 min after transfer from air containing 5% CO2 to ambient air, and the 21-kD polypeptide was detected on western blots after 1 h. When transferred back to air containing 5% CO2, the mRNA disappeared within 1 h and the polypeptide was degraded within 3 d. Photosynthesis was required for the induction in asynchronous cultures. The induction increased with light up to 500 mumol m-2 s-1, where saturation occurred. In cells grown synchronously, however, expression of the mitochondrial CA was also detected in darkness. Under such conditions the expression followed a circadian rhythm, with mRNA appearing in the dark 30 min before the light was turned on. Algae left in darkness continued this rhythm for several days.


Figures

Figure 1
Figure 1
Time-course experiments of the induction and degradation of mtCA. A, Northern analysis of the relative amounts of the mtCA mRNA. High-CO2-grown cells were transferred to low-CO2 conditions at time 0. After 24 h, the culture was transferred back to high-CO2 conditions. The triangle represents cells left on low CO2 for 1 week. All lanes on the northern blot contained 5 μg of total RNA. B, Western blot of the induction of mtCA. Numbers represent hours after transfer to low CO2. All lanes contained 0.5 μg of protein. C, Western blot of the degradation of mtCA. Numbers represent hours after transfer from low CO2 to high CO2. All lanes contained 0.5 μg of protein.
Figure 2
Figure 2
Western-blot analysis of the induction and degradation of mtCA under mixotrophic and phototrophic growth. A, Amount of mtCA in cells adapted to low-CO2 conditions for 4 or 8 h in the absence (−Ac) or presence (+Ac) of acetate in the growth medium. All lanes contained 0.5 μg of protein. B, Amount of mtCA in low-CO2-adapted phototrophic cells after transfer to three different growth conditions for 3 d.
Figure 3
Figure 3
Induction of mtCA under different light intensities. A, The relative amount of mtCA mRNA after transfer to low-CO2 conditions for 15 (▴), 30 (•), and 60 (▪) min under different light intensities. All lanes on the northern blot contained 5 μg of total RNA. B, Western blot of mtCA after 2 h of induction to low-CO2 conditions under different light intensities. The light intensities were: lane 1, 25; lane 2, 75; lane 3, 150; lane 4, 300; lane 5, 450; and lane 6, 1200 μmol m−2 s−1. All lanes contained 0.5 μg of protein.
Figure 4
Figure 4
The induction of mtCA under red light. Western-blot analysis of samples withdrawn from the culture before (5% CO2) and after (air) 4 h of induction under red light (684 nm) of 10 μmol m−2 s−1. Both lanes contained 0.5 μg of protein.
Figure 5
Figure 5
Northern-blot analyses of mtCA mRNA levels in synchronously grown cells. After three light/dark cycles, the culture was transferred to low CO2 at the beginning of the fourth dark period. A, Cells left under a light/dark regime. B, Cells transferred to continuous darkness. Samples for mRNA analyses were withdrawn 1, 6, and 11 h into the light period and 1, 6, and 11.5 h into the dark period. All lanes on the northern blot contained 5 μg of total RNA.

References

    1. Badger MR, Price GD. The CO2 concentrating mechanism in cyanobacteria and microalgae. Physiol Plant. 1992;84:606–615.
    1. Bailly J, Coleman JR. Effect of CO2 concentration on protein biosynthesis and carbonic anhydrase expression in Chlamydomonas reinhardtii. Plant Physiol. 1988;87:833–840. - PMC - PubMed
    1. Burow MD, Chen ZY, Mouton TM, Moroney JV. Isolation of cDNA clones of genes induced upon transfer of Chlamydomonas reinhardtii cells to low CO2. Plant Mol Biol. 1996;31:443–448. - PubMed
    1. Chen Z-Y, Burow MD, Mason CB, Moroney JV. A low-CO2 inducible gene encoding an alanine:α-ketoglutarate aminotransferase in Chlamydomonas reinhardtii. Plant Physiol. 1996;112:677–684. - PMC - PubMed
    1. Chen Z-Y, Lavigne LL, Mason CB, Moroney JV. Cloning and overexpression of two cDNAs encoding the low-CO2-inducible chloroplast envelope protein LIP-36 from Chlamydomonas reinhardtii. Plant Physiol. 1997;114:265–273. - PMC - PubMed

LinkOut - more resources