. 1998 Apr 1;508 ( Pt 1)(Pt 1):15-21.
doi: 10.1111/j.1469-7793.1998.015br.x.

The human Na+-glucose cotransporter is a molecular water pump

Affiliations

The human Na+-glucose cotransporter is a molecular water pump

A Meinild et al. J Physiol. .

Abstract

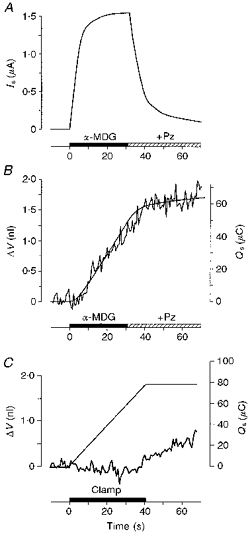
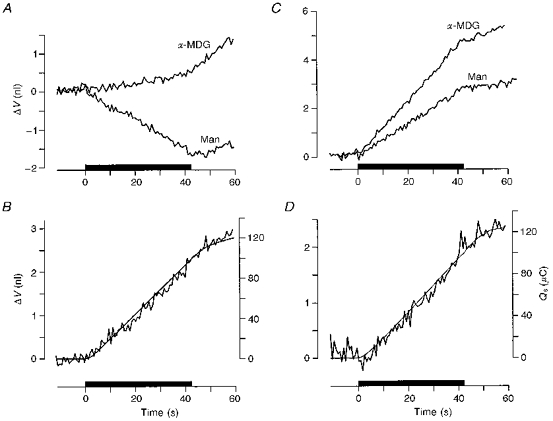
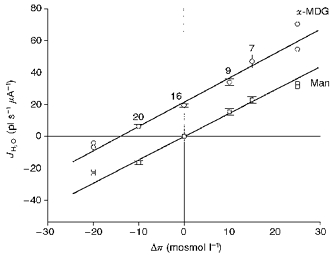
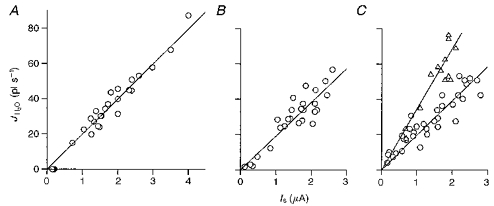
1. The human Na+-glucose cotransporter (hSGLT1) was expressed in Xenopus laevis oocytes. The transport activity, given by the Na+ current, was monitored as a clamp current and the concomitant flux of water followed optically as the change in oocyte volume. 2. When glucose was added to the bathing solution there was an abrupt increase in clamp current and an immediate swelling of the oocyte. The transmembrane transport of two Na+ ions and one sugar molecule was coupled, within the protein itself, to the influx of 210 water molecules. 3. This stoichiometry was constant and independent of the external parameters: Na+ concentrations, sugar concentrations, transmembrane voltages, temperature and osmotic gradients. 4. The cotransport of water occurred in the presence of adverse osmotic gradients. In accordance with the Gibbs equation, energy was transferred within the protein from the downhill fluxes of Na+ and sugar to the uphill transport of water, indicative of secondary active transport of water. 5. Unstirred layer effects were ruled out on the basis of experiments on oocytes treated with gramicidin or other ionophores. Na+ currents maintained by ionophores did not lead to any initial water movements. 6. The finding of a molecular water pump allows for new models of cellular water transport which include coupling between ion and water fluxes at the protein level; the hSGLT1 could account for almost half the daily reuptake of water from the small intestine.


Figures

Figure 1
Figure 1. Correspondence between sugar-induced current and water flow under isotonic conditions
An hSGLT1-expressing oocyte was clamped continuously at a membrane potential of −50 mV by two-microelectrode voltage clamp. 10 mm of a transported sugar (α-MDG) was introduced abruptly into the bath (filled bar) where it replaced, isotonically, 10 mm mannitol. A, this caused an inward current (Is), which increased rapidly towards a maximum of 1540 nA (90 % complete in 13 s). B, the current was associated with a linear increase in oocyte volume (ΔV, jagged line) indicative of a constant rate of water influx of 36 pl s−1. The volume increase and the current were abolished by the addition of 50 μm phlorizin (+Pz). In the present experiment the integrated current (Qs, smooth line in B) describes the volume changes, if we assume that the entry of two Na+ ions and one sugar molecule couples directly to the entry of 249 water molecules. C, there was no initial change in oocyte volume when the inward Na+ current was mediated by the cation-selective gramicidin channel. An inward current of about 1900 nA was obtained (not shown) by changing the intracellular electrical potential from the resting potential (about −45 mV, not shown) to −100 mV by means of the voltage clamp (filled bar). The current, carried by Na+ ions, did not give rise to any immediate change in cell volume (jagged line in C) and the integrated current (smooth line) had no resemblance to the volume changes. The oocyte expressed hSGLT1 to the same degree as the one used in A and B, but the cotransporter was kept inactive since no sugar was present.
Figure 2
Figure 2. Uphill and downhill transport of water by the hSGLT1
A and B, uphill transport. A, the oocyte was clamped to −50 mV and 10 mm of sugar was added to the bathing solution (filled bar) equivalent to an increase of the extracellular osmolarity of 10 mosmol l−1. This caused an inwardly directed current (not shown) and a linear increase in oocyte volume (ΔV, top curve, α-MDG). If the extracellular osmolarity was increased by 10 mosmol l−1 by the addition of 10 mm mannitol, the oocyte shrank as expected from a simple osmometer (bottom curve, Man). The difference between the two volume changes is given as the jagged line in B and represents cotransport of water mediated by the hSGLT1 under the hypertonic conditions. The integrated current (Qs, smooth line in B) describes the volume changes if it is assumed that the hSGLT1 cotransports 202 water molecules for each two Na+ ions and one sugar molecule. C and D, downhill transport of water by the hSGLT1. In C, 20 mm mannitol was replaced abruptly by 10 mm sugar (filled bar), a decrease of the extracellular osmolarity of 10 mosmol l−1. This caused an inwardly directed current (not shown) and a rapid linear increase in oocyte volume (top curve, α-MDG). If the extracellular osmolarity was decreased by 10 mosmol l−1 by removing mannitol, the oocyte swelled at a slower rate (bottom curve, Man). The difference between the two volume changes represents the cotransport of water mediated by the hSGLT1 under the hypotonic conditions (D, jagged line). The integrated current (Qs, smooth line in D) describes the volume changes if it is assumed that 195 water molecules enter coupled directly to the entry of two Na+ ions and one sugar molecule. Small swellings were observed after the bathing solution was changed to a sugar-free solution due to the finite washing out time for sugar.
Figure 3
Figure 3. Active, sugar-induced (α-MDG) and osmotic, mannitol-induced (Man) water fluxes mediated by hSGLT1 as a function of the transmembrane osmotic difference Δπ
Data were obtained as described in Figs 1 and 2, and were performed at a clamp potential of −50 mV, and Na+ concentration of 90 mm. The fraction of the water flux going through the native oocyte membrane has been subtracted. The water fluxes through the hSGLT1 were normalized relative to the sugar-induced current obtained at isotonic conditions with 10 mm sugar. The number of observations at each point are indicated; values at -20 and +25 mosmol l−1 are single observations. The slope of the two lines represents the passive water permeability of the hSGLT1. In addition, sugar induces a constant contribution to the total water flux, as evidenced by the constant vertical displacement of the two lines in agreement with the prediction of the Gibbs equation (see text). Thus the vertical displacement of the two curves gives the coupling ratio of the hSGLT1 in picolitres of water transported per microcoulomb.
Figure 4
Figure 4. Cotransport of water as function of the Na+ current when this is altered by varying the membrane potential (A), the external Na+ concentration (B; substituting with choline) and the external sugar concentration (C; substituting with mannitol)
In A the clamp voltage was varied over the range +20 to −100 mV at external Na+ concentrations of 90 mm and sugar concentrations of 10 mm; the relation between the water flux and clamp currents was linear, given by JH2O (pl s−1) = 20.0 ± 0.42 Is (μA) (r= 0.99), indicative of a coupling ratio of 215 water molecules per 2 Na+. In B Na+ concentrations were varied over the range 1–90 mm at a clamp potential of −50 mV; the sugar concentration was 10 mm. JH2O (pl s−1) = 19.4 ± 0.7 Is (μA) (r= 0.91), indicative of a coupling ratio of 208 water molecules per 2 Na+. In C sugar concentrations were varied between 0.1 and 20 mm, at 90 mm Na+ and a clamp potential of −50 mV. JH2O (pl s−1) = 19.4 ± 0.7 Is (μA) (r= 0.92), indicative of a coupling ratio of 209 water molecules per 2 Na+. For comparison we show an example of data obtained with an oocyte expressing rabbit sglt1 (▵) (Zeuthen et al. 1997). This protein has a larger coupling ratio than the hSGLT1: 390 water molecules per 2 Na+, in the present example 323 water molecules per 2 Na+ and 1 glucose; JH2O (pl s−1) = 33.2 ± 1.4 Is (μA) (r= 0.88).

References

    1. Colombo MF, Rau DC, Parsegian VA. Protein solvation in allosteric regulation: A water effect on hemoglobin. Science. 1992;256:655–659. - PubMed
    1. Diamond JM. Wet transport proteins. Nature. 1996;384:611–612. 10.1038/384611a0. - DOI - PubMed
    1. Gutiérrez AM, Gonzalez E, Echevarria M, Hernandez CS, Whittembury G. The proximal straight tubule (PST) basolateral cell membrane water channel: selectivity characteristics. Journal of Membrane Biology. 1995;143:189–197. - PubMed
    1. Hediger MA, Turk E, Wright EM. Homology of the human intestinal Na+/glucose and Escherichia coli Na+/proline cotransporters. Proceedings of the National Academy of Sciences of the USA. 1989;86:5748–5752. - PMC - PubMed
    1. Hirayama BA, Loo DDF, Wright EM. Cation effects on protein conformation and transport in the Na+/glucose cotransporter. Journal of Biological Chemistry. 1997;272:2110–2115. 10.1074/jbc.272.4.2110. - DOI - PubMed

Publication types

MeSH terms

LinkOut - more resources