

Gramicidin-perforated patch revealed depolarizing effect of GABA in cultured frog melanotrophs
- PMID: 9490816
- PMCID: PMC2230773
- DOI: 10.1111/j.1469-7793.1998.055bu.x
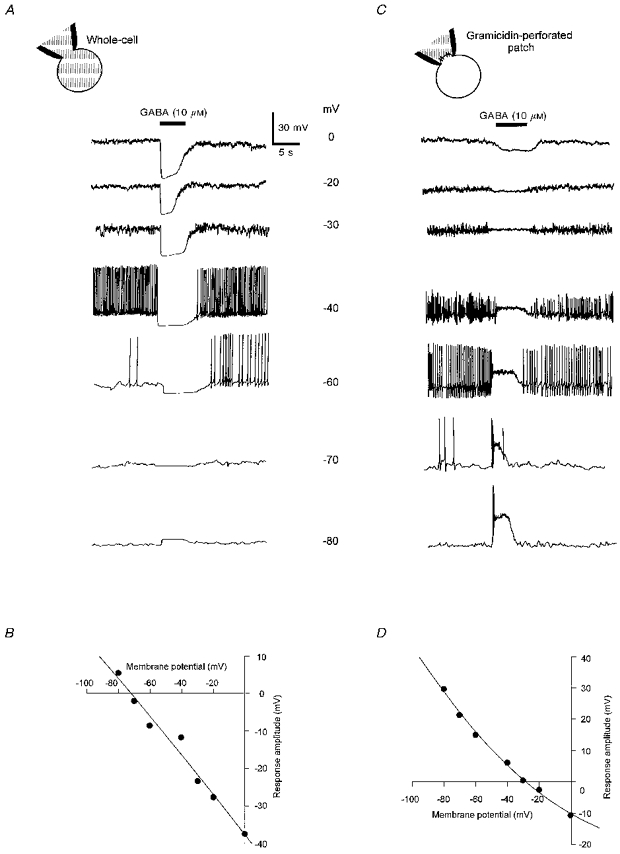
Gramicidin-perforated patch revealed depolarizing effect of GABA in cultured frog melanotrophs
Abstract
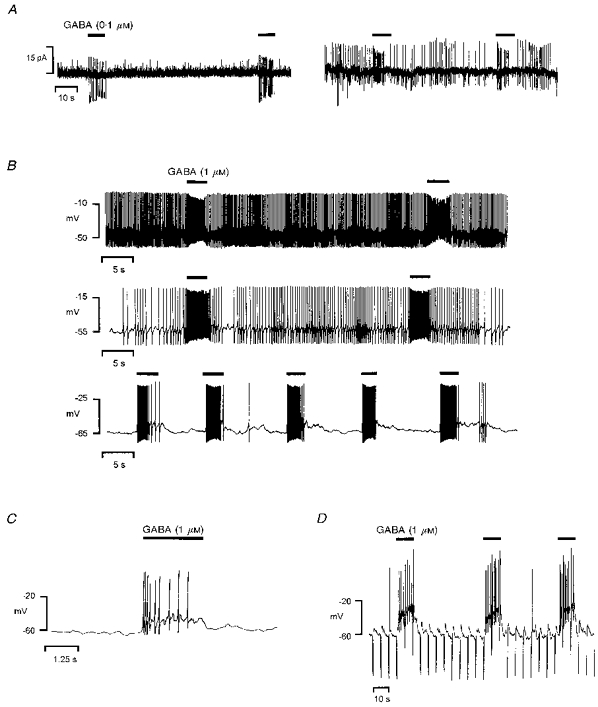
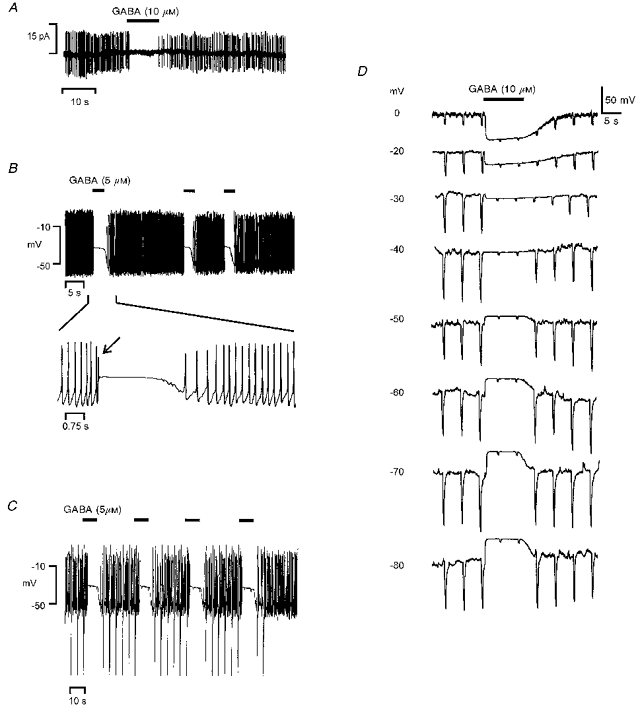
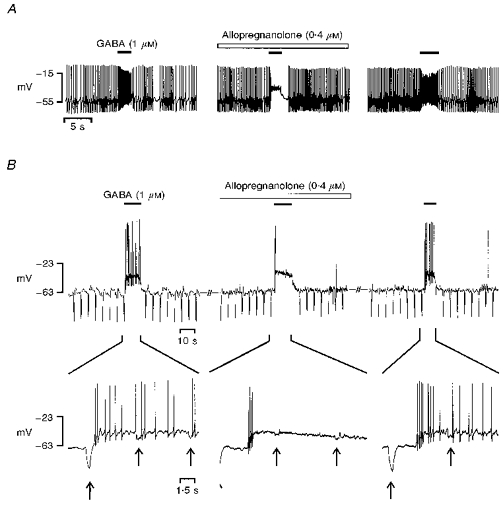
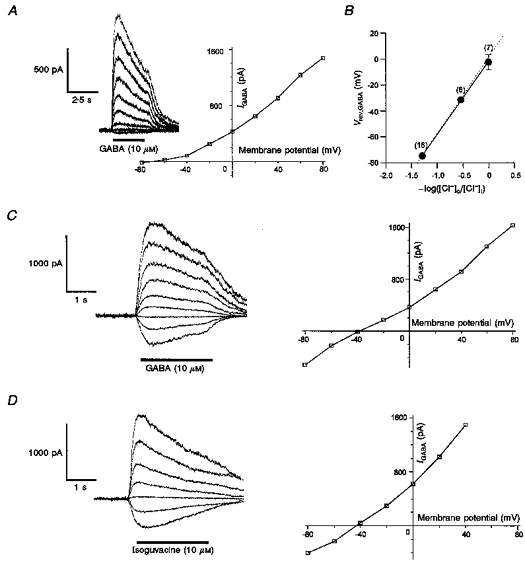
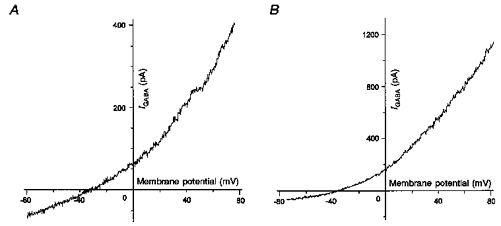
1. In frog pituitary melanotrophs, GABA induces a transient stimulation followed by prolonged inhibition of hormone secretion. This biphasic effect is inconsistent with the elevation of cytosolic calcium and the inhibition of electrical activity also provoked by GABA in single melanotrophs. In the present study, standard patch-clamp configurations and gramicidin-perforated patches were used to investigate the physiological GABAA receptor-mediated response and intracellular chloride concentration ([Cl-]i) in cultured frog melanotrophs. 2. In the gramicidin-perforated patch configuration, 1 microM GABA caused a depolarization associated with an action potential discharge and a slight fall of membrane resistance. In contrast, at a higher concentration (10 microM) GABA elicited a depolarization accompanied by a transient volley of action potentials, followed by a sustained inhibitory plateau and a marked fall of membrane resistance. Isoguvacine mimicked the GABA-evoked responses, indicating a mediation by GABAA receptors. 3. In gramicidin-perforated cells, the depolarizing excitatory effect of 1 microM GABA was converted into a depolarizing inhibitory action when 0.4 microM allopregnanolone was added to the bath solution. 4. After gaining the whole-cell configuration, the amplitude and/or direction of the GABA-evoked current (IGABA) rapidly changed before stabilizing. After stabilization, the reversal potential of IGABA followed the values predicted by the Nernst equation for chloride ions when [Cl-]i was varied. 5. In gramicidin-perforated cells, the steady-state I-V relationships of 10 microM GABA- or isoguvacine-evoked currents yielded reversal potentials of -37.5 +/- 1.6 (n = 17) and -38.6 +/- 2.0 mV (n = 8), respectively. These values were close to those obtained by using a voltage-ramp protocol in the presence of Na+, K+ and Ca2+ channel blockers. The current evoked by 1 microM GABA also reversed at these potentials. 6. We conclude that, in frog pituitary melanotrophs, chloride is the exclusive charge carrier of IGABA. In intact cells, the reversal potential of IGABA is positive to the resting potential because of a relatively high [Cl-]i (26.5 mM). Under these conditions, GABA induces a chloride efflux responsible for a depolarization triggering action potentials. However, GABA at a high concentration or in the presence of the potentiating steroid allopregnanolone exerts a concomitant shunting effect leading to a rapid inhibition of the spontaneous firing.
Figures


Similar articles
-
Multiple modulatory effects of the neuroactive steroid pregnanolone on GABAA receptor in frog pituitary melanotrophs.J Physiol. 1997 Oct 15;504 ( Pt 2)(Pt 2):387-400. doi: 10.1111/j.1469-7793.1997.387be.x. J Physiol. 1997. PMID: 9365913 Free PMC article.
-
Contribution of changes in the chloride driving force to the fading of I(GABA) in frog melanotrophs.Am J Physiol Endocrinol Metab. 2000 Mar;278(3):E430-43. doi: 10.1152/ajpendo.2000.278.3.E430. Am J Physiol Endocrinol Metab. 2000. PMID: 10710497
-
Mechanism of action of gamma-aminobutyric acid on frog melanotrophs.J Mol Endocrinol. 1995 Feb;14(1):1-12. doi: 10.1677/jme.0.0140001. J Mol Endocrinol. 1995. PMID: 7772233
-
[Gramicidin perforated patch recording technique].Nihon Yakurigaku Zasshi. 1999 Jun;113(6):339-47. doi: 10.1254/fpj.113.339. Nihon Yakurigaku Zasshi. 1999. PMID: 10524360 Review. Japanese.
-
Multiple control of calcium channel gating by dopamine D2 receptors in frog pituitary melanotrophs.Ann N Y Acad Sci. 1993 May 31;680:211-28. doi: 10.1111/j.1749-6632.1993.tb19686.x. Ann N Y Acad Sci. 1993. PMID: 8390152 Review. No abstract available.
Cited by
-
Synaptotoxicity of Alzheimer beta amyloid can be explained by its membrane perforating property.PLoS One. 2010 Jul 27;5(7):e11820. doi: 10.1371/journal.pone.0011820. PLoS One. 2010. PMID: 20676404 Free PMC article.
-
Molecular mechanisms of pituitary endocrine cell calcium handling.Cell Calcium. 2012 Mar-Apr;51(3-4):212-21. doi: 10.1016/j.ceca.2011.11.003. Epub 2011 Dec 3. Cell Calcium. 2012. PMID: 22138111 Free PMC article. Review.
-
Sigma receptors [σRs]: biology in normal and diseased states.J Recept Signal Transduct Res. 2016 Aug;36(4):327-388. doi: 10.3109/10799893.2015.1015737. Epub 2015 Jun 9. J Recept Signal Transduct Res. 2016. PMID: 26056947 Free PMC article.
-
A depolarizing chloride current contributes to chemoelectrical transduction in olfactory sensory neurons in situ.J Neurosci. 1998 Sep 1;18(17):6623-30. doi: 10.1523/JNEUROSCI.18-17-06623.1998. J Neurosci. 1998. PMID: 9712634 Free PMC article.
-
Dependence of the excitability of pituitary cells on cyclic nucleotides.J Neuroendocrinol. 2012 Sep;24(9):1183-200. doi: 10.1111/j.1365-2826.2012.02335.x. J Neuroendocrinol. 2012. PMID: 22564128 Free PMC article. Review.
References
-
- Adjeroud S, Tonon MC, Lamacz M, Leneveu E, Stoeckel ME, Tappaz ML, Cazin L, Danger JM, Bernard C, Vaudry H. GABA-ergic control of α-melanocyte-stimulating hormone (α-MSH) release by frog neurointermediate lobe in vitro. Brain Research Bulletin. 1986;17:717–723. 10.1016/0361-9230(86)90206-6. - DOI - PubMed
-
- Anderson RA, Mitchell R. Effects of γ-aminobutyric acid receptor agonists on the secretion of growth hormone, luteinizing hormone, adrenocorticotrophic hormone and thyroid stimulating hormone from the rat pituitary gland in vitro. Journal of Endocrinology. 1986a;108:1–8. - PubMed
-
- Anderson RA, Mitchell R. Biphasic effect of GABAA receptor agonists on prolactin secretion: evidence for two types of GABAA receptor complex on lactotrophs. European Journal of Pharmacology. 1986b;124:1–9. 10.1016/0014-2999(86)90118-4. - DOI - PubMed
-
- Bloom F, Iversen LL. Localizing [3H]GABA in nerve terminals of rat cerebral cortex by electronmicroscopic autoradiography. Nature. 1971;229:628–630. - PubMed
Publication types
MeSH terms
Substances
LinkOut - more resources
Full Text Sources
Miscellaneous