

Intracellular calcium and Na+-Ca2+ exchange current in isolated toad pacemaker cells
- PMID: 9490832
- PMCID: PMC2230862
- DOI: 10.1111/j.1469-7793.1998.153br.x
Intracellular calcium and Na+-Ca2+ exchange current in isolated toad pacemaker cells
Abstract
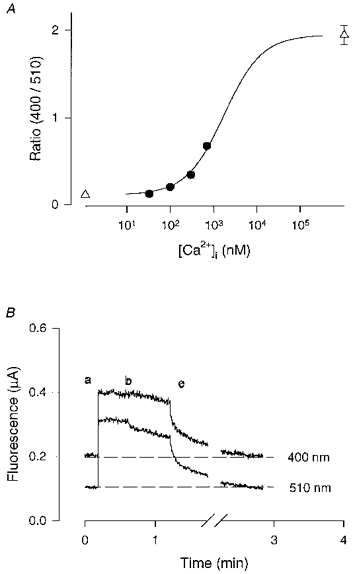
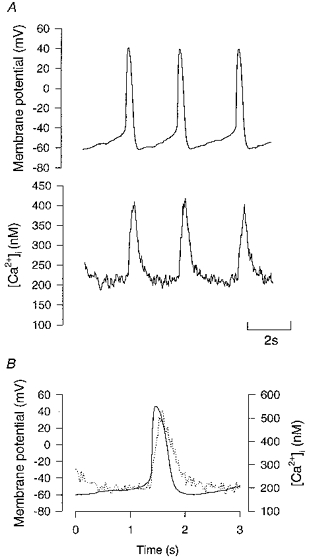
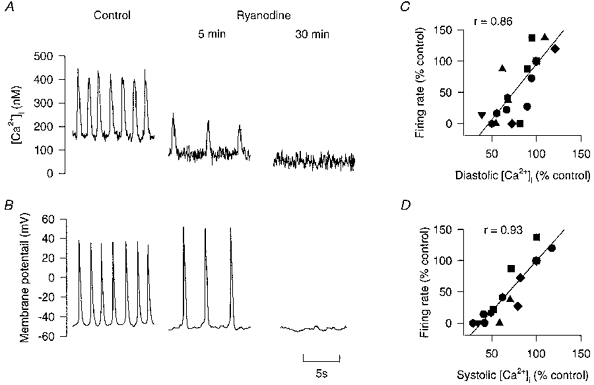
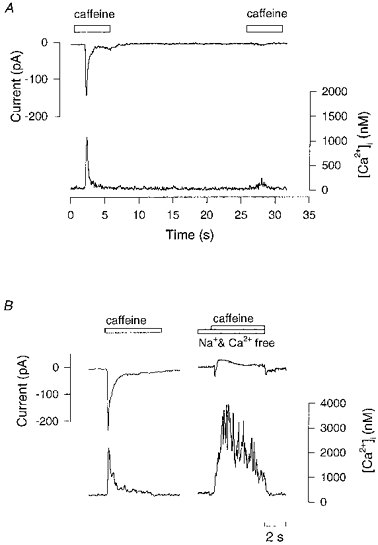
1. Single pacemaker cells were isolated from the sinus venosus of cane toad (Bufo marinus) in order to study the mechanisms involved in the spontaneous firing rate of action potentials. Intracellular calcium concentration ([Ca2+]i) was measured with indo-1 to determine whether [Ca2+]i influenced firing rate. A rapid transient rise of [Ca2+]i was recorded together with each spontaneous action potential. [Ca2+]i at the peak of systole was 655 +/- 64 nM and the minimum at the end of diastole was 195 +/- 15 nM. 2. Reduction of extracellular Ca2+ concentration from 2 to 0.5 mM caused a reduction in both systolic and diastolic [Ca2+]i and the spontaneous firing rate also gradually declined. 3. Application of the acetoxymethyl (AM) ester of BAPTA (10 microM), in order to increase intracellular calcium buffering, caused a decline in systolic and diastolic [Ca2+]i. The firing rate declined progressively until the cells stopped firing after 10-15 min. At the time that firing ceased, the diastolic [Ca2+]i had declined by 141 +/- 38 nM. 4. In the presence of ryanodine (2 microM), which interferes with Ca2+ release from the sarcoplasmic reticulum, the systolic and diastolic [Ca2+]i both declined and the firing rate decreased until the cells stopped firing. At quiescence diastolic [Ca2+]i had declined by 93 +/- 20 nM. 5. Exposure of the cells to Na+-free solution caused a rise in [Ca2+]i which exceeded the systolic level after 4.8 +/- 0.3 s. This rise is consistent with Ca2+ entry on a Na+-Ca2+ exchanger. 6. Rapid application of caffeine (10-20 mM) to cells clamped at -60 mV caused a rapid increase in [Ca2+]i which then spontaneously declined. An inward current with a similar time course to that of [Ca2+]i was also generated. Application of Ni2+ (5 mM) or 2,4-dichlorobenzamil (25 microM) reduced the amplitude of the inward current produced by caffeine by 96 +/- 1 % and 74 +/- 10 %, respectively. In a Na+-free solution the caffeine-induced current was reduced by 93 +/- 7 %. 7. Under a variety of circumstances the diastolic [Ca2+]i showed a close association with pacemaker firing rate. The existence of a Na+-Ca2+ exchanger and its estimated contribution to inward current during the pacemaker potential suggest that the Na+-Ca2+ exchange current makes a contribution to pacemaker activity.
Figures


Similar articles
-
The mechanisms of sarcoplasmic reticulum Ca2+ release in toad pacemaker cells.J Physiol. 2000 Jun 15;525 Pt 3(Pt 3):695-705. doi: 10.1111/j.1469-7793.2000.t01-1-00695.x. J Physiol. 2000. PMID: 10856122 Free PMC article.
-
Ionic basis of ryanodine's negative chronotropic effect on pacemaker cells isolated from the sinoatrial node.Am J Physiol. 1997 Nov;273(5):H2481-9. doi: 10.1152/ajpheart.1997.273.5.H2481. Am J Physiol. 1997. PMID: 9374788
-
How does beta-adrenergic stimulation increase the heart rate? The role of intracellular Ca2+ release in amphibian pacemaker cells.J Physiol. 1999 May 1;516 ( Pt 3)(Pt 3):793-804. doi: 10.1111/j.1469-7793.1999.0793u.x. J Physiol. 1999. PMID: 10200426 Free PMC article.
-
Does Ca2+ release from the sarcoplasmic reticulum influence heart rate?Clin Exp Pharmacol Physiol. 2001 Aug;28(8):703-8. doi: 10.1046/j.1440-1681.2001.03506.x. Clin Exp Pharmacol Physiol. 2001. PMID: 11473539 Review.
-
Unique Ca2+-Cycling Protein Abundance and Regulation Sustains Local Ca2+ Releases and Spontaneous Firing of Rabbit Sinoatrial Node Cells.Int J Mol Sci. 2018 Jul 25;19(8):2173. doi: 10.3390/ijms19082173. Int J Mol Sci. 2018. PMID: 30044420 Free PMC article. Review.
Cited by
-
Regionally diverse mitochondrial calcium signaling regulates spontaneous pacing in developing cardiomyocytes.Cell Calcium. 2015 May;57(5-6):321-36. doi: 10.1016/j.ceca.2015.02.003. Epub 2015 Feb 18. Cell Calcium. 2015. PMID: 25746147 Free PMC article.
-
Long-term Xenopus laevis tadpole -heart-organ-culture: Physiological changes in cholinergic and adrenergic sensitivities of tadpole heart with thyroxine-treatment.Curr Res Physiol. 2023 Jun 7;6:100100. doi: 10.1016/j.crphys.2023.100100. eCollection 2023. Curr Res Physiol. 2023. PMID: 38107785 Free PMC article.
-
The Cardiac Pacemaker Story-Fundamental Role of the Na+/Ca2+ Exchanger in Spontaneous Automaticity.Front Pharmacol. 2020 Apr 28;11:516. doi: 10.3389/fphar.2020.00516. eCollection 2020. Front Pharmacol. 2020. PMID: 32410993 Free PMC article. Review.
-
What keeps us ticking: a funny current, a calcium clock, or both?J Mol Cell Cardiol. 2009 Aug;47(2):157-70. doi: 10.1016/j.yjmcc.2009.03.022. Epub 2009 Apr 8. J Mol Cell Cardiol. 2009. PMID: 19361514 Free PMC article. Review.
-
Delayed afterdepolarization in intact canine sinoatrial node as a novel mechanism for atrial arrhythmia.J Cardiovasc Electrophysiol. 2011 Apr;22(4):448-54. doi: 10.1111/j.1540-8167.2010.01905.x. Epub 2010 Oct 6. J Cardiovasc Electrophysiol. 2011. PMID: 21040091 Free PMC article.
References
-
- Anderson K, Lai FA, Liu QY, Rousseau E, Erickson HP, Meissner G. Structural and functional characterization of the purified cardiac ryanodine receptor-Ca2+ release channel complex. Journal of Biological Chemistry. 1989;264:1329–1335. - PubMed
-
- Barry PH, Lynch JW. Liquid junction potentials and small cell effects in patch-clamp analysis. Journal of Membrane Biology. 1991;121:101–117. - PubMed
Publication types
MeSH terms
Substances
LinkOut - more resources
Full Text Sources
Research Materials
Miscellaneous