

Facilitating pyramid to horizontal oriens-alveus interneurone inputs: dual intracellular recordings in slices of rat hippocampus
- PMID: 9490837
- PMCID: PMC2230767
- DOI: 10.1111/j.1469-7793.1998.185bu.x
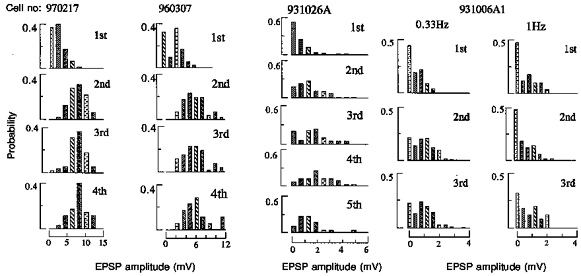
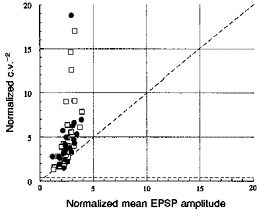
Facilitating pyramid to horizontal oriens-alveus interneurone inputs: dual intracellular recordings in slices of rat hippocampus
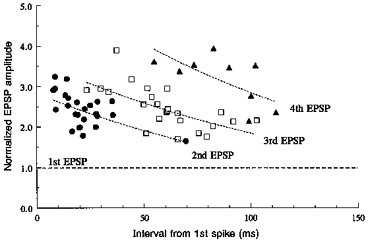
Abstract
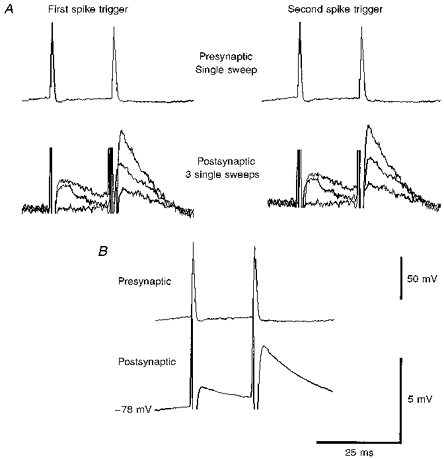
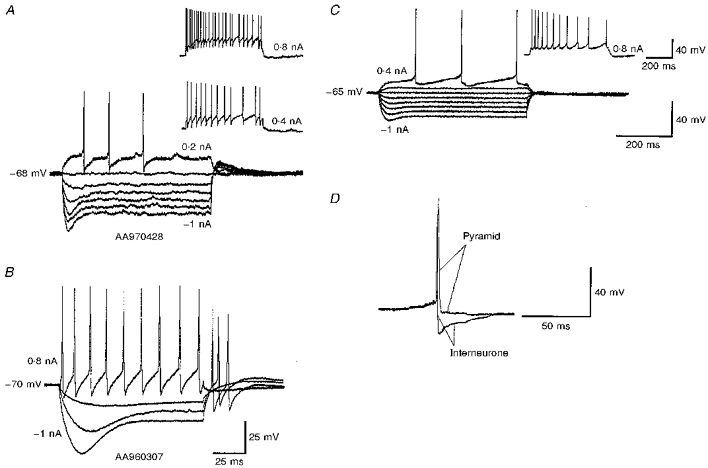
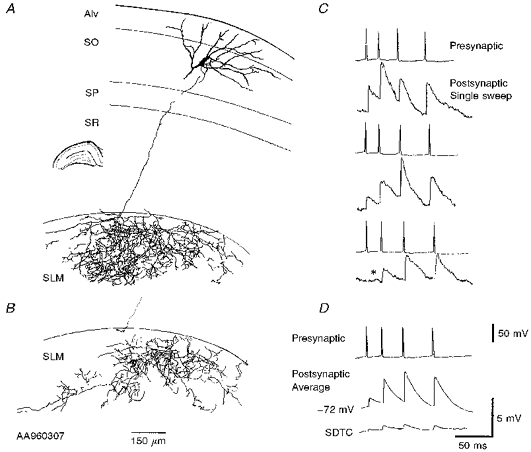
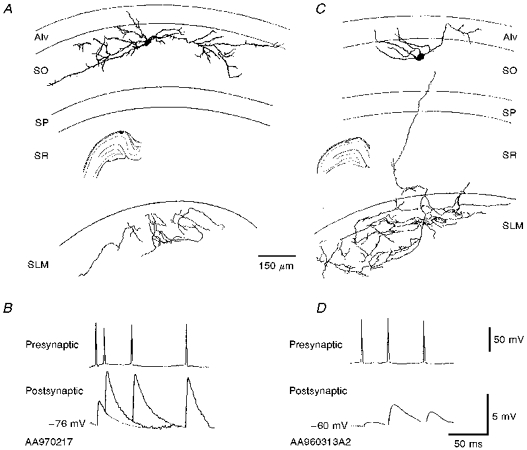
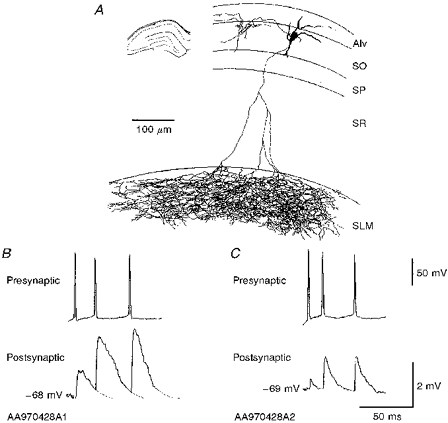
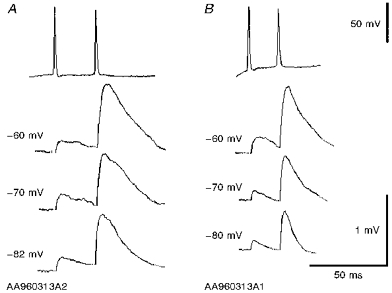
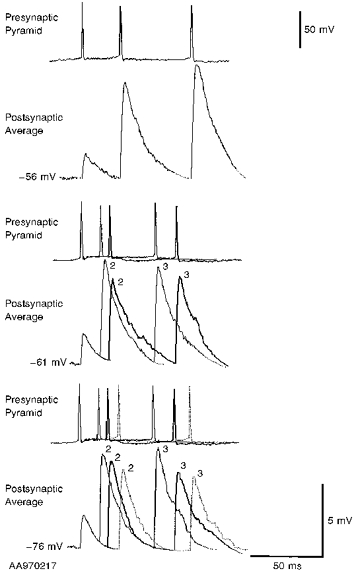
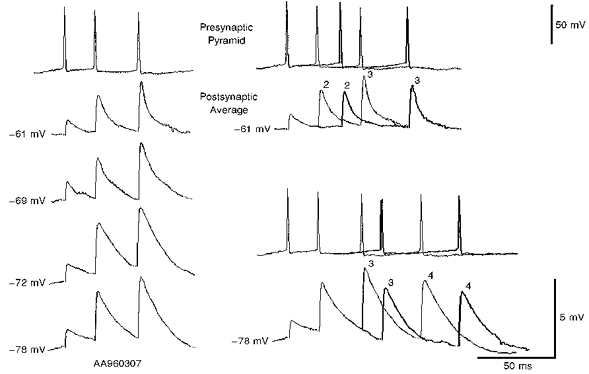
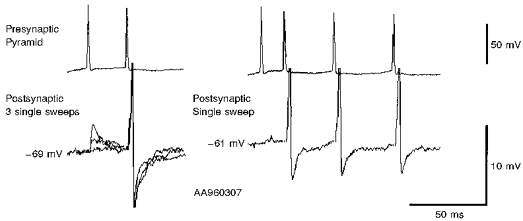
1. In adult rat hippocampal slices, simultaneous intracellular recordings from pyramidal cells in CA1 and interneurones near the stratum oriens-alveus border revealed excitatory connections that displayed facilitation on repetitive activation in twelve of thirty-six pairs tested. 2. Postsynaptic interneurones were classified as horizontal oriens-alveus interneurones by the pronounced 'sag' in response to hyperpolarizing current injection, high levels of spontaneous synaptic activity and by the morphology of their somata and dendrites, which were confined to stratum oriens-alveus and their axons which projected to stratum lacunosum-moleculare where they ramified extensively, in the region of entorhinal cortex input to CA1. 3. Excitatory postsynaptic potentials (EPSPs) elicited by single pyramidal cells were 0 to 12 mV in amplitude. Mean EPSP amplitude (single spikes) was 0.93 +/- 1. 06 mV at -70 +/- 2.3 mV (n = 10). The rise time was 1.2 +/- 0.5 ms and the width at half-amplitude was 7.5 +/- 4.7 ms. 4. EPSPs fluctuated greatly in amplitude; the mean coefficient of variation was 0.84 +/- 0.37 for the first EPSP and 0.47 +/- 0.24 for the second. Apparent failures of transmission frequently occurred after first presynaptic spikes but less frequently after the second or subsequent spikes in brief trains. 5. EPSPs displayed facilitation at membrane potentials between -80 mV and spike threshold. Second EPSPs within 20 ms of the first were 253 +/- 48 % (range, 152-324 %) of the mean first EPSP amplitude. Third EPSPs within 60 ms were 266 +/- 70 % (range, 169-389 %) and fourth EPSPs within 60-120 ms were 288 +/- 71 % (range, 188-393 %). Both proportions of apparent failures of transmission and coefficient of variation analysis indicated a presynaptic locus for this facilitation.
Figures

References
-
- Ali AB, Thomson AM. Pharmacology of CA1 pyramid to oriens alveus interneurone connections in rat hippocampus. Society for Neuroscience Abstracts. 1996;317:1.
-
- Ali AB, Thomson AM. Brief train depression and facilitation at pyramid-interneurone connections in slices of rat hippocampus; paired recordings with biocytin filling. The Journal of Physiology. 1997;501.P:9. P.
-
- Blasco-Ibanez JM, Freund TF. Synaptic input of horizontal interneurones in stratum oriens of the hippocampal CA1 subfield: structural basis of feedback activation. European Journal of Neuroscience. 1995;7:2170–2180. - PubMed
-
- Buckmaster PS, Kunkel DD, Robbins RJ, Schwartzkroin PA. Somatostatin-immuno-reactivity in the hippocampus of mouse, rat, guinea pig and rabbit. Hippocampus. 1994;4:167–180. - PubMed
Publication types
MeSH terms
Substances
Grants and funding
LinkOut - more resources
Full Text Sources
Miscellaneous