. 1998 Apr 1;508 ( Pt 1)(Pt 1):223-36.
doi: 10.1111/j.1469-7793.1998.223br.x.

Spatio-temporal receptive fields in carp retinal horizontal cells

Affiliations

Spatio-temporal receptive fields in carp retinal horizontal cells

O Umino et al. J Physiol. .

Abstract

1. The dynamics of the receptive fields of retinal horizontal cells were examined by applying a spatio-temporal modulated light signal to the retina. 2. The spatio-temporal receptive fields of both cone- and rod-driven horizontal cells, estimated through cross-correlation between the modulated light signal and the cells' responses, showed their receptive fields (the space-dependent component) to be reduced in size with time. 3. In cone-driven horizontal cells, the reduction in receptive field size was initially small but then rapidly became prominent with time. The time to peak of the time-dependent component of spatio-temporal receptive fields did not depend on the distance from the centre. 4. Application of a small amount of Co2+, an agent blocking the cone-driven horizontal cells' feedback action on cones, or GABA, resulted in a reversal of the time-dependent shrinkage of receptive fields to time-dependent expansion. 5. In rod-driven horizontal cells, the receptive field shrinkage was slow. The time to peak of the time-dependent component decreased with the distance from the centre. 6. Image processing experiments examining the response pattern in the horizontal cell layer (neural image) to a moving square of light showed smudging of the neural image when the time-dependent receptive field expansion was present, while there was essentially no smudging under conditions of receptive field shrinkage.


Figures
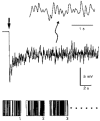
Figure 1
Figure 1. Cone-driven luminosity-type horizontal cell response to light modulated randomly in space and time
When the modulated light was delivered to the retina (the downward arrow), the horizontal cells showed a rapid hyperpolarization followed by a slow declining phase after which they reached a stationary state. Horizontal cells showed a sharp membrane potential fluctuation in response to the modulated light. A portion of the membrane potential fluctuation was recorded at a higher sweep speed (upper trace). Lower stripes indicate the initial part of the modulated light; each image, composed of forty-eight narrow slits (50 μm × 1 mm for one slit on the retina) the intensity of which, modulated in m-sequence fashion, was sequentially delivered as indicated by the numbers 1, 2, 3, etc. at intervals of 1/60 s. The light intensities were 0.35 × 10⁻⁴μW cm−2 for dark slits and 0.2 × 10⁻²μW cm−2 for light slits.
Figure 2
Figure 2. Estimated spatio-temporal receptive fields of cone-driven luminosity-type horizontal cells
The spatio-temporal receptive field, h1, calculated by cross-correlating the response with the stripes (see Methods), was plotted on the plane composed of the space axis (x′, position displacements in mm on the retina) and the time displacement axis (τ in ms), and then viewed from three different angles (A, B, C). Plots in B correspond to the traditional receptive fields, while plots in C correspond to the cell's responses to a slit flash. Note that horizontal cells showed a hyperpolarizing response to light, but the spatio-temporal receptive field was plotted with the negative values upward. Small fluctuations on the plane were caused mainly by the electrical noise included in the response recorded. Although no absolute value is shown, the ordinate for the spatio-temporal receptive field is in units of V × unit area W−1 s−1.
Figure 3
Figure 3. Shrinkage of spatio-temporal receptive field with time displacement
Cone-driven luminosity-type horizontal cells. A, receptive fields, the space-dependent component of the spatio-temporal receptive field, at various time displacements were normalized with their maximum value at the centre (0 mm) and were superimposed logarithmically; note that one side of each receptive field was plotted. Numbers near the plots indicate the time displacement in ms; the spatio-temporal receptive field has its peak at 70 ms (see Fig. 2C). Time displacement (ms): ×, 50; □, 70 (peak); ▪, 90; ▴, 100; •, 120. A straight line was drawn to fit the peripheral part of the three receptive fields, and their slopes correspond to a length constant of 144 μm at 70 ms (peak), 59 μm at 100 ms, and 30 μm at 120 ms. B, a counter map showing the time courses of relative receptive fields. As in A, individual receptive fields at different times were normalized with their peak value at the centre (0 mm) and viewed from the top. In other words, this illustration corresponds to a top view of Fig. 2A, but with each receptive field normalized using the receptive field centre values. Numbers near the traces indicate the value (in %) of receptive fields relative to their maximum amplitudes at the centre (0 mm). The dashed line marked 100 % indicates the receptive field centre. Data from Figs 1 and 2.
Figure 4
Figure 4. Dynamics of the sizes of receptive fields
Cone-driven luminosity-type horizontal cells. Receptive field size was evaluated from the slope of the space-dependent components of spatio temporal receptive fields. The slope values were measured by fitting an exponential function to the data at the periphery of the space-dependent components (see Fig. 3A) and were plotted as a function of the time displacement. n= 11.
Figure 5
Figure 5. Expansion of spatio-temporal receptive fields with time displacement
Cone-driven luminosity-type horizontal cells. Experiments were conducted in a Co2+ (50 μm)-containing solution, which blocks the feedback signal transmission from horizontal cells to cones (Umino et al. 1989). A, receptive fields at various times were normalized with their maximum value at the centre (0 mm) and were superimposed logarithmically. Time displacement (ms) is indicated by the numbers near the symbols. The peak of the spatio-temporal receptive field was at 80 ms. The slopes of the straight lines correspond to a length constant of 93 μm at 20 ms, 144 μm at 80 ms (peak), and 223 μm at 140 ms. B, a counter plot showing the dynamics of relative receptive fields. Plots as in Fig. 3B.
Figure 6
Figure 6. The time to peak of the time-dependent component of the spatio-temporal receptive field as a function of the position displacements
The mean of the time to peak was plotted. Cone-driven luminosity-type horizontal cells. A, in normal solution. n= 7. B, in a Co2+-containing solution. n= 8. The standard deviation at each position was within 15 ms.
Figure 7
Figure 7. Rod-driven horizontal cell response to light modulated randomly in space and time
The modulated light was delivered to the retina at the point indicated by the downward arrow. Lower stripes indicate the initial part of the modulated light; each image, composed of 48 narrow slits (50 μm × 1 mm for one slit on the retina) the intensities of which were modulated in m- sequence fashion, was sequentially delivered as indicated by the numbers 1, 2, 3, etc. at intervals of 1/20 s. The light intensities were 0.35 × 10⁻⁷μW cm−2 for dark slits and 0.2 × 10⁻⁵μW cm−2 for light slits.
Figure 8
Figure 8. Estimated spatio-temporal receptive fields of rod-driven horizontal cells
The spatio-temporal receptive field was plotted on the plane composed of the space axis (x′, position displacements in millimetres on the retina) and the time displacement axis (τ in ms), and was viewed from three different angles (A, B, C). For further explanation, see Fig. 2.
Figure 9
Figure 9. Shrinkage of spatio-temporal receptive field with time displacement. Rod-driven horizontal cells
A, receptive fields, the space-dependent component of the spatio-temporal receptive fields, at various time displacements were normalized with their maximum value at the centre (0 mm) and were superimposed logarithmically; note that one-side of each receptive field was plotted. Numbers near the plots indicate the time displacement in ms; the spatio-temporal receptive field has its peak at 290 ms (see Fig. 8). Numbers near the plots indicate the time displacement in ms. Data from Fig. 8. B, a counter map showing the time courses of relative receptive fields. As in A, individual receptive fields at different times were normalized with their peak value at the centre (0 mm) and viewed from the top. Numbers near the traces indicate the value (in %) of receptive fields relative to their maximum amplitudes at the centre (0 mm). The dashed line marked 100 % indicates the receptive field centre. For further explanation, see Fig. 3.
Figure 10
Figure 10. Changes in the time-dependent components of spatio-temporal receptive fields. Rod-driven horizontal cells
Data from Fig. 8. A, superimposed components at the centre (continuous line) and periphery, 0.15 mm from the centre (dotted line). B, the time to peak of the time-dependent component plotted as a function of the distance from the centre.
Figure 11
Figure 11. Image processing experiments examining the activity pattern of the horizontal cell layer in response to a moving square
A, input pattern of one white moving square. One image was 100 × 100 pixels and each image was connected. A similar connecting of images was conducted for the neural images, Bb and Cb. B, control. Ba, theoretical spatio-temporal receptive field reduced in size with time. The theoretical spatio-temporal receptive field, F(t, x, y), is represented by: where, n is 2 and σ is 5 pixels. The size of F is 20 × 20 pixels. tpeak is the time (ms) to the peak of F. Bb, neural image of the horizontal cell layer. The dark area represents the membrane potential of horizontal cells in darkness, while the white regions are the horizontal cell activities of hyperpolarizing responses to the moving square in A. Neural images, H(t, x, y), were calculated by convolution of the input signal (A), M(t, x, y), with the theoretical spatio-temporal receptive field (Ba), F(t, x, y), as follows: Neural activity (white area) was not seen at 0 ms because of the delay in the horizontal cell response to the input square. Activity patterns appeared in the neural image from 100 ms. The neural activity of white regions was blurred because of the large receptive fields of the horizontal cells. C, spatio-temporal receptive field expanded with time. Ca, theoretical spatio-temporal receptive field, which can be computed from eqn (2) except for the following parameter: Cb, neural image of the horizontal cell layer. Neural activity was nearly identical to that for the control at 100 ms (Bb), while the smudging became evident at 200, 300 and 400 ms.

Similar articles

References

    1. Baldridge WH, Ball AK. Background illumination reduces horizontal cells receptive field size in both normal and 6-hydroxydopamine-lesioned goldfish retinas. Visual Neuroscience. 1991;7:441–450. - PubMed
    1. Baylor DA, Fuortes MGF, O'Bryan PM. Receptive fields of single cones in the retina of the turtle. Journal of Physiology. 1971;214:265–294. - PMC - PubMed
    1. Byzov AL, Shura-Bura TM. Spread of potentials along the network of horizontal cells in the retina of the turtle. Vision Research. 1983;23:389–397. - PubMed
    1. Byzov AL, Trifonov, Yu A, Chailahian LM, Golubtzov KW. Amplification of graded potentials in horizontal cells of the retina. Vision Research. 1977;17:265–273. - PubMed
    1. Chappell RL, Naka K-I, Sakuranaga M. Dynamics of turtle horizontal cell response. Journal of General Physiology. 1985;86:423–453. - PMC - PubMed

Publication types

MeSH terms

Substances

LinkOut - more resources