

Allosteric regulation by cytoplasmic Ca2+ and IP3 of the gating of IP3 receptors in permeabilized guinea-pig vascular smooth muscle cells
- PMID: 9490868
- PMCID: PMC2230722
- DOI: 10.1111/j.1469-7793.1998.407bw.x
Allosteric regulation by cytoplasmic Ca2+ and IP3 of the gating of IP3 receptors in permeabilized guinea-pig vascular smooth muscle cells
Abstract
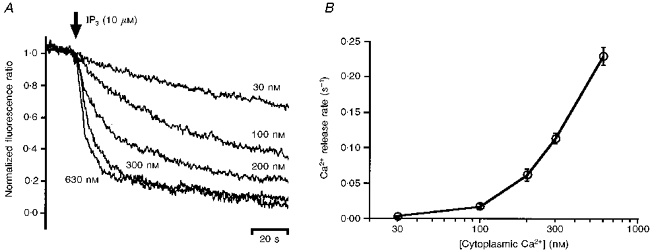
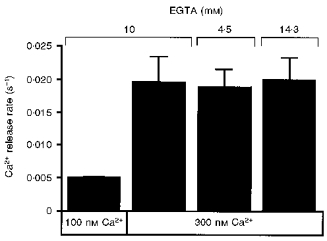
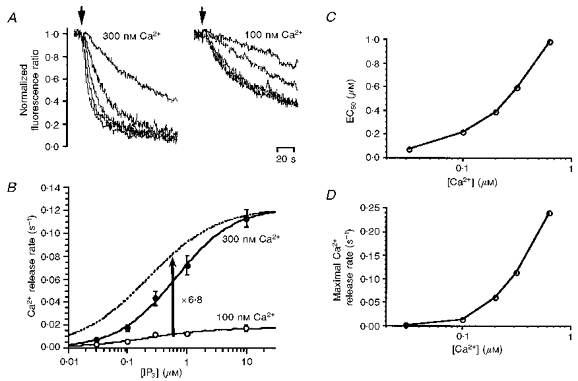
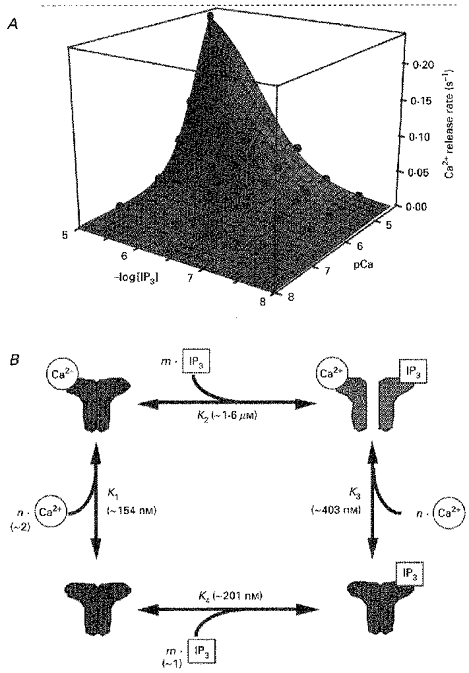
1. The potentiation by Ca2+ of inositol 1,4,5-trisphosphate (IP3)-induced Ca2+ release was studied by measuring luminal Ca2+ concentrations of the Ca2+ stores using a fluorescent Ca2+ indicator, furaptra, in permeabilized smooth muscle cells. 2. Ca2+ release at 10 microM IP3 was potentiated by an increase in the cytoplasmic Ca2+ concentration in the presence of 10 mM EGTA. This effect was not due to the pharmacological effect of EGTA, because changes in the EGTA concentration at a constant Ca2+ concentration had no effect on the Ca2+ release rate. 3. With an increase in the cytoplasmic Ca2+ concentration from 30 to 630 nM, the Ca2+ release rate at a saturating IP3 concentration increased 110-fold and the EC50 for IP3 increased from 0.07 to 1.0 microM. It was also indicated that the relationship between Ca2+ concentration and Ca2+ release rate was shifted towards higher Ca2+ concentrations at higher IP3 concentrations. 4. These results suggest that IP3 and submicromolar concentrations of Ca2+ allosterically lower the affinity of the IP3 receptor for each other and are both required for IP3 receptor activation. These properties enable the IP3 receptors to detect simultaneous increases in IP3 and Ca2+ concentrations.
Figures
Similar articles
-
Inositol 1,4,5-trisphosphate [correction of tris-phosphate] activation of inositol trisphosphate [correction of tris-phosphate] receptor Ca2+ channel by ligand tuning of Ca2+ inhibition.Proc Natl Acad Sci U S A. 1998 Dec 22;95(26):15821-5. doi: 10.1073/pnas.95.26.15821. Proc Natl Acad Sci U S A. 1998. PMID: 9861054 Free PMC article.
-
pH dependence of inositol 1,4,5-trisphosphate-induced Ca2+ release in permeabilized smooth muscle cells of the guinea-pig.J Physiol. 1994 Mar 15;475(3):369-75. doi: 10.1113/jphysiol.1994.sp020078. J Physiol. 1994. PMID: 8006822 Free PMC article.
-
Caffeine inhibits Ca(2+)-mediated potentiation of inositol 1,4,5-trisphosphate-induced Ca2+ release in permeabilized vascular smooth muscle cells.Biochem Biophys Res Commun. 1993 Jul 30;194(2):726-32. doi: 10.1006/bbrc.1993.1882. Biochem Biophys Res Commun. 1993. PMID: 8343156
-
New developments in the molecular pharmacology of the myo-inositol 1,4,5-trisphosphate receptor.Trends Pharmacol Sci. 1998 Nov;19(11):467-75. doi: 10.1016/s0165-6147(98)01260-7. Trends Pharmacol Sci. 1998. PMID: 9850611 Review.
-
Identification of Ca(2+)-release channels in smooth muscle and isolated membranes.Biol Signals. 1993 Sep-Oct;2(5):284-92. doi: 10.1159/000109509. Biol Signals. 1993. PMID: 8038860 Review.
Cited by
-
Voltage-dependent inward currents of interstitial cells of Cajal from murine colon and small intestine.J Physiol. 2002 Jun 15;541(Pt 3):797-810. doi: 10.1113/jphysiol.2002.018796. J Physiol. 2002. PMID: 12068041 Free PMC article.
-
Crosstalk between ryanodine receptors and IP(3) receptors as a factor shaping spontaneous Ca(2+)-release events in rabbit portal vein myocytes.J Physiol. 2002 Aug 1;542(Pt 3):743-62. doi: 10.1113/jphysiol.2001.015966. J Physiol. 2002. PMID: 12154176 Free PMC article.
-
The role of Ca2+ feedback in shaping InsP3-evoked Ca2+ signals in mouse pancreatic acinar cells.J Physiol. 1999 Oct 1;520 Pt 1(Pt 1):187-201. doi: 10.1111/j.1469-7793.1999.00187.x. J Physiol. 1999. PMID: 10517811 Free PMC article.
-
Regulation of IP(3)R Channel Gating by Ca(2+) and Ca(2+) Binding Proteins.Curr Top Membr. 2010;66:235-72. doi: 10.1016/S1063-5823(10)66011-5. Epub 2010 Jul 25. Curr Top Membr. 2010. PMID: 22353483 Free PMC article. No abstract available.
-
Inositol 1,4,5-trisphosphate [correction of tris-phosphate] activation of inositol trisphosphate [correction of tris-phosphate] receptor Ca2+ channel by ligand tuning of Ca2+ inhibition.Proc Natl Acad Sci U S A. 1998 Dec 22;95(26):15821-5. doi: 10.1073/pnas.95.26.15821. Proc Natl Acad Sci U S A. 1998. PMID: 9861054 Free PMC article.
References
Publication types
MeSH terms
Substances
LinkOut - more resources
Full Text Sources
Miscellaneous