. 1998 Jan 15;506 ( Pt 2)(Pt 2):431-44.
doi: 10.1111/j.1469-7793.1998.431bw.x.

Changes in force and cytosolic Ca2+ concentration after length changes in isolated rat ventricular trabeculae

Affiliations

Changes in force and cytosolic Ca2+ concentration after length changes in isolated rat ventricular trabeculae

J C Kentish et al. J Physiol. .

Abstract

1. Changes in cytosolic [Ca2+] ([Ca2+]i) were measured in isolated rat trabeculae that had been micro-injected with fura-2 salt, in order to investigate the mechanism by which twitch force changes following an alteration of muscle length. 2. A step increase in length of the muscle produced a rapid potentiation of twitch force but not of the Ca2+ transient. The rapid rise of force was unaffected by inhibiting the sarcoplasmic reticulum (SR) with ryanodine and cyclopiazonic acid. 3. The force-[Ca2+]i relationship of the myofibrils in situ, determined from twitches and tetanic contractions in SR-inhibited muscles, showed that the rapid rise of force was due primarily to an increase in myofibrillar Ca2+ sensitivity, with a contribution from an increase in the maximum force production of the myofibrils. 4. After stretch of the muscle there was a further, slow increase of twitch force which was due entirely to a slow increase of the Ca2+ transient, since there was no change in the myofibrillar force-[Ca2+]i relationship. SR inhibition slowed down, but did not alter the magnitude of, the slow force response. 5. During the slow rise of force there was no slow increase of diastolic [Ca2+]i, whether or not the SR was inhibited. The same was true in unstimulated muscles. 6. We conclude that the rapid increase in twitch force after muscle stretch is due to the length-dependent properties of the myofibrils. The slow force increase is not explained by length dependence of the myofibrils or the SR, or by a rise in diastolic [Ca2+]i. Evidence from tetani suggests the slow force responses result from increased Ca2+ loading of the cell during the action potential.


Figures

Figure 1
Figure 1. Distribution of fura-2 along an isolated rat trabecula at various times after iontophoresis of fura-2 into three myocardial cells in the preparation
A, absolute fluorescence readings. The distribution of fura-2 fluorescence plus muscle autofluorescence (excitation, 380 nm) was recorded in a ≈450 μm-wide window passed along the muscle at the following times after the end of the iontophoresis: •, 30 min; ○, 60 min; ▪, 120 min; and □, 210 min. Arrows indicate the approximate sites of iontophoresis. Distance was measured from the start of muscle tissue at the valvular end of the muscle. Similar results were recorded with 340 nm excitation (not shown). B, same data as in A, but expressed relative to the maximum fluorescence at that time. The horizontal arrow shows the typical recording distance (≈1 mm) used in the length-change experiments. The relative rise of fura-2 fluorescence at the right-hand side later in the experiment occurred as fura-2 diffused into the greater mass of tissue at this (ventricular wall) end of the muscle.
Figure 3
Figure 3. The effects of the length changes on twitch force and on the diastolic and systolic fluorescence ratios (340 nm/380 nm)
A, twitch (active) force during the different periods (1–5) of Fig. 1A. B, systolic fluorescence ratio (○) and diastolic ratio (▵) for the same periods. Note the break in the ordinate. The abscissae indicate muscle length and the time in minutes at which data recording (lasting 48 s) was started after the length change. L90 represents a length of 90%L0. Points show means ±s.e.m., n = 15. Where no error bars are shown, s.e.m. is less than the size of the symbol. Symbols next to the data points indicate results of paired t tests between each value and the corresponding value in the preceding period. *P < 0.05; †P < 0.001.
Figure 4
Figure 4. The effects of the length changes on the time course of the twitch and fluorescence transients
Left-hand panels, force transients; right-hand panels, 340 nm/380 nm fluorescence transients. A and B, time from the stimulus to peak force and fluorescence. C and D, time from the peak to 50% relaxation (RT50) of force and fluorescence. E and F, time from the peak to 90% relaxation (RT90) of force and fluorescence. The abscissae indicate muscle length and the time in minutes at which data recording was started after the length change. L90 represents a length of 90%L0. Data are expressed as means ±s.e.m., n = 15. Symbols next to the data points indicate results of paired t tests between each value and the corresponding value in the preceding period. *P < 0.05; †P < 0.01.
Figure 7
Figure 7. Fura-2 fluorescence ratio after length changes in unstimulated muscles
A, in normal muscles with active SR (n = 4). B, in muscles treated with 1 μM ryanodine plus 30 μM cyclopiazonic acid to inhibit the SR (n = 3). The abscissae indicate muscle length and the time when data recording was started after the length change. L90 represents a length of 90%L0. Points show mean values ±s.e.m.
Figure 2
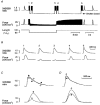
Figure 2. Typical records of the changes in fura-2 fluorescence ratio and force produced by shortening a rat trabecula by 10% for 15 min
A, chart records of 340 nm/380 nm fluorescence ratio and force, with a representation of the length change from the initial length (L0). A shutter in the excitation light pathway was opened only for discrete 48 s recording periods (labelled 1–5) in order to avoid photobleaching of fura-2. The shutter was closed also during the adjustment of muscle length using a micromanipulator. Traces were scanned digitally from the original records (filtered at 15 Hz). Note the slow changes in twitch force after the changes in muscle length. B, mean records (from 16 twitches) of fluorescence ratio and force measured during periods 1–5 in A. Unfiltered records. C, overlaid traces of the fluorescence ratio and force averaged during periods 3 (○) and 4 (•) to illustrate the rapid effects of the length increase. Resting forces have been subtracted from these traces. D, similar overlaid traces averaged during periods 4 (•) and 5 (⋄) to illustrate the delayed effects of the length increase. 24 °C, 1 mM external Ca2+, 0.33 Hz stimulation rate.
Figure 5
Figure 5. Typical records of the changes in fura-2 fluorescence ratio and force produced by shortening a trabecula for 15 min in the presence of SR inhibitors
A, chart records of 340 nm/380 nm fluorescence ratio and force, with a representation of the length change. The record was taken > 1 h after the addition of ryanodine (1 μM) and cyclopiazonic acid (30 μM). Other details as in Fig. 2. Note that force is lower than in Fig. 2, but the slow changes of force after a change of muscle length are still present. B, mean records (from 16 twitches) of fluorescence ratio and force measured during periods 1–5 in A.
Figure 6
Figure 6. The effects of the length changes on twitch force and on the diastolic and systolic fluorescence ratios in the presence of SR inhibitors
A, twitch (active) force during the different periods (1–5) of Fig. 5A. B, systolic fluorescence ratio (○) and diastolic ratio (▵) during the same periods. Note the break in the ordinate. Muscles were incubated in the presence of ryanodine (1 μM) and cyclopiazonic acid (30 μM) for at least 1 h before measurements were taken. The abscissae indicate muscle length and the time in minutes at which data recording was started after the length change. L90 represents a length of 90%L0. Points show means ±s.e.m., n = 6. Where no error bars are shown s.e.m. is less than the size of the symbol. Symbols next to the data points indicate results of paired t tests between each value and the corresponding value in the preceding period. *P < 0.05; †P < 0.01; ‡P < 0.001.
Figure 8
Figure 8. Changes in force and systolic fura-2 fluorescence in a typical trabecula in response to alterations of stimulation frequency or muscle length
The relationship between peak force and peak fluorescence ratio during the twitches was determined under two conditions: (i) the trabecula was held at constant length (L0) and was stimulated at various frequencies from 0.2 to 2.5 Hz (▪); (ii) the muscle was stimulated at 1 Hz throughout and muscle length was reduced by 10% for 15 min (□). The numbers correspond to the periods shown in Fig. 1A. The slow force increase after re-lengthening of the muscle, i.e. from periods 4 to 5, exhibits the same force-[Ca2+]i relationship as obtained with the changes of frequency. Similar results were seen in three other muscles.
Figure 9
Figure 9. Representative plots of force against fluorescence ratio measured throughout the twitches at different lengths
The muscles was treated with ryanodine (1 μM) and cyclopiazonic acid (30 μM). The changes in force and fluorescence ratio throughout the twitch are plotted for twitches: in the steady state at L90 (○), in the first minute after muscle re-lengthening to L0 (•), and after 15 min at L0 (⋄). Arrows indicate the direction of the loops. Note that the relaxation (left-hand) part of these phase-plane plots is shifted leftwards by the increase in muscle length, suggesting an increase of myofibrillar Ca2+ sensitivity, but then follows a constant trajectory over the time course of the slow rise of twitch force. Similar results were seen in three other muscles.
Figure 10
Figure 10. Force and fluorescence ratio during tetanic contractions at various muscle lengths
A and B, fluorescence ratio and force, respectively, during tetanic contractions at L0 (•) and at L90 (○) in a typical muscle. Tetani were produced by 10 Hz stimulation (in 8 mM Ca2+, 1 μM ryanodine and 30 μM cyclopiazonic acid). C, force versus fluorescence ratio during the relaxation phase of the tetani at L0 (•) and L90 (○). Sigmoid curves are fits to the Hill equation: force = maximum force × rationH/(K½nH+ rationH), with nH= 8.05 and K½= 2.03 at L0 and with nH= 7.57 and K½= 2.59 at L90. D, tetanic force at different muscle lengths. Forces are expressed relative to that at L0. Means ±s.e.m. of three experiments. Where no error bars are shown, s.e.m. is less than the size of the symbol.

Similar articles

Cited by

References

    1. Allen DG. On the relationship between action potential duration and tension in cat papillary muscle. Cardiovascular Research. 1977;11:210–218. - PubMed
    1. Allen DG, Kentish JC. The cellular basis of the length-tension relationship in cardiac muscle. Journal of Molecular and Cellular Cardiology. 1985;17:821–840. - PubMed
    1. Allen DG, Kentish JC. Calcium concentration in the myoplasm of skinned ferret muscle following changes in muscle length. Journal of Physiology. 1988;407:489–503. - PMC - PubMed
    1. Allen DG, Kurihara S. The effects of muscle length on intracellular calcium transients in mammalian cardiac muscle. Journal of Physiology. 1982;327:79–94. - PMC - PubMed
    1. Allen DG, Nichols CG, Smith GL. The effects of changes in muscle length during diastole on the calcium transient in ferret ventricular muscle. Journal of Physiology. 1988;406:359–370. - PMC - PubMed

Publication types

MeSH terms

LinkOut - more resources