. 1998 Mar;180(5):1044-52.
doi: 10.1128/JB.180.5.1044-1052.1998.

Msn2p and Msn4p control a large number of genes induced at the diauxic transition which are repressed by cyclic AMP in Saccharomyces cerevisiae

Affiliations

Msn2p and Msn4p control a large number of genes induced at the diauxic transition which are repressed by cyclic AMP in Saccharomyces cerevisiae

E Boy-Marcotte et al. J Bacteriol. 1998 Mar.

Abstract

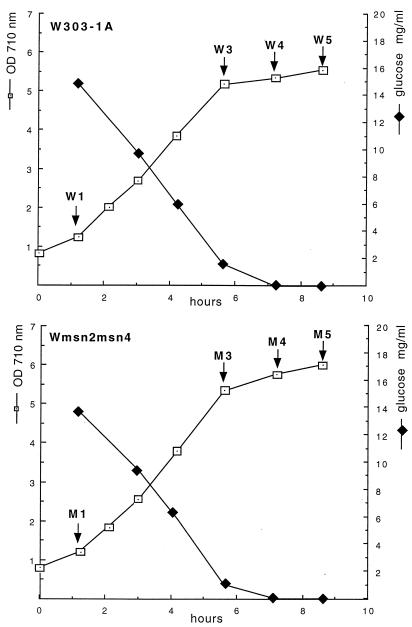
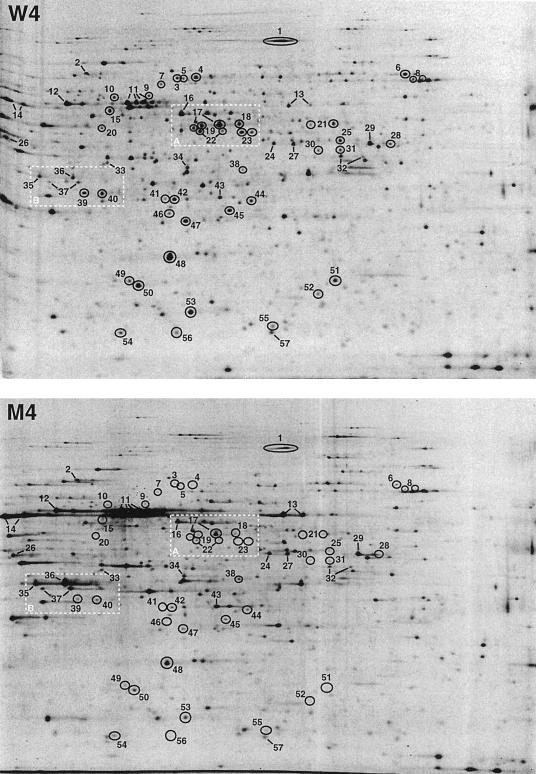
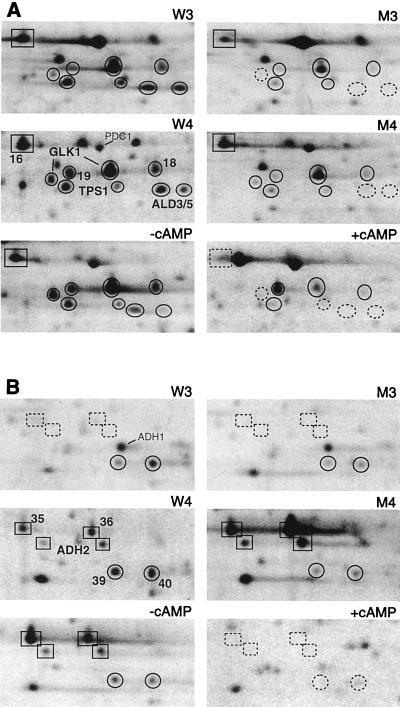
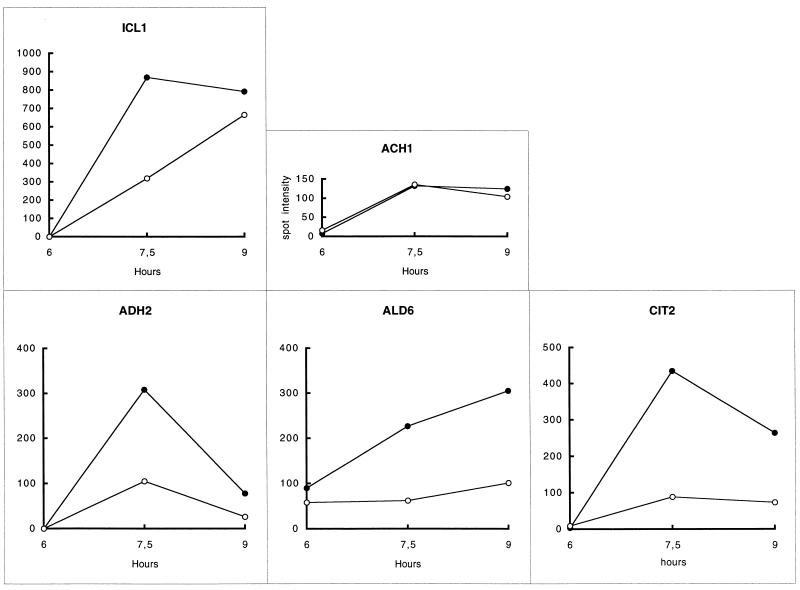
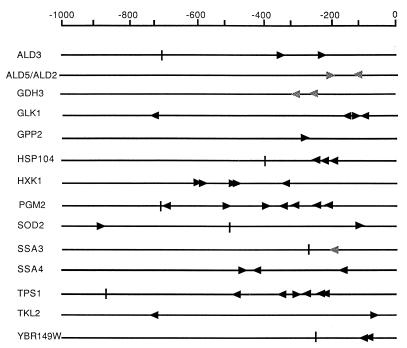
The multicopy suppressors of the snf1 defect, Msn2p and Msn4p transcription factors (Msn2/4p), activate genes through the stress-responsive cis element (CCCCT) in response to various stresses. This cis element is also the target for repression by the cyclic AMP (cAMP)-signaling pathway. We analyzed the two-dimensional gel electrophoresis pattern of protein synthesis of the msn2 msn4 double mutant and compared it with that of the wild-type strain during exponential growth phase and at the diauxic transition. Thirty-nine gene products (including those of ALD3, GDH3, GLK1, GPP2, HSP104, HXK1, PGM2, SOD2, SSA3, SSA4, TKL2, TPS1, and YBR149W) are dependent upon Msn2/4p for their induction at the diauxic transition. The expression of all these genes is repressed by cAMP. Thirty other genes identified during this study are still inducible in the mutant. A subset of these genes were found to be superinduced at the diauxic transition, and others were subject to cAMP repression (including ACH1, ADH2, ALD6, ATP2, GPD1, ICL1, and KGD2). We conclude from this analysis that Msn2/4p control a large number of genes induced at the diauxic transition but that other, as-yet-uncharacterized regulators, also contribute to this response. In addition, we show here that cAMP repression applies to both Msn2/4p-dependent and -independent control of gene expression at the diauxic shift. Furthermore, the fact that all the Msn2/4p gene targets are subject to cAMP repression suggests that these regulators could be targets for the cAMP-signaling pathway.


Figures

FIG. 1
FIG. 1
Growth of strains Wmsn2-msn4 and W303-1A. Growth in YNBS medium was monitored by turbidimetry at 710 nm (open squares). Glucose concentration was monitored in the medium during growth (filled squares). Arrows indicate the withdrawal of samples for labelling proteins with [35S]methionine.
FIG. 2
FIG. 2
Comparison between proteins of W303-1A and Wmsn2-msn4 synthesized at the diauxic transition by 2-D gel protein pattern analysis. Sample cultures (0.5 ml) from W303-1A (W3, W4, and W5) and Wmsn2-msn4 (M3, M4, and M5) (see Fig. 1) were labelled for 60 min with 3.7 × 10⁶ mBq of [35S]methionine (>3.7 × 10¹³ mBqm · mol−1; Amersham). After the labelling period, the cells were washed and extracted in 200 μl of extraction buffer. An aliquot of 15 μl was loaded onto the 1-D gel. Radioactivity on the gels was revealed with a PhosphorImager (Molecular Dynamics Inc.). Image intensities were adjusted so that the actin spot on the different images would have approximately the same intensity. Images from W4 (upper panel) and M4 (lower panel) are presented. Polypeptides are numbered from 1 to 57. Polypeptides which correspond to different isoforms of the same protein were assigned the same number. Their characteristics are reported in Tables 1 and 2. Polypeptides which are dependent upon Msn2/4p for the induction of their synthesis at the diauxic transition are indicated by circles, and those whose induction is independent of Msn2/4p and repressed by cAMP are shown by lines. The two framed regions are enlarged in Fig. 3.
FIG. 3
FIG. 3
Enlargement of the two regions framed in Fig. 2, from maps obtained with samples W3, M3, W4, and M4 and from maps S1 and S1+cAMP, previously published (7), obtained with samples from strain OL556 at the diauxic transition without (−) or with (+) cAMP. Glk1p, Tps1p, and Ald3/5p (A) and Adh2p (B) correspond to spots 17, 22, 23, 37, respectively, on the map for sample W4 (Fig. 2). The superinduction of Adh2p (B) and the polypeptides 16 (A) and 35 and 36 (B) in the msn2 msn4 mutant are illustrated.
FIG. 4
FIG. 4
Gene products superinduced in the msn2 msn4 mutant. The kinetics of induction at the end of growth (Fig. 1) was monitored for each gene product by measuring the intensities of the spots on maps for samples W3, W4, and W5 and M3, M4, and M5. Open circles, W303-1A; closed circles, Wmsn2-msn4.
FIG. 5
FIG. 5
Induction mediated by STRE and the cAMP-negative effect. Strain OL556-STRE was grown in YNBS medium without uracil and without or with cAMP (3 mM) at 28°C. Growth was monitored by turbidimetry at 710 nm, and samples were withdrawn from the culture without cAMP (open circles) and with cAMP (filled circles). β-Galactosidase activity and protein concentration measurements were performed in the cellular extracts. For each sample, units of β-galactosidase activity accumulated per milliliter of culture, without (open circles) or with (filled circles) cAMP, were plotted against the protein concentration accumulated in the cultures (milligrams/milliliter). Protein concentration was calculated from the turbidity values for each sample, from the cell concentration per unit of turbidity, and from the cell-soluble protein content (7). For each sample, β-galactosidase activity per milliliter of culture was calculated by multiplying the β-galactosidase specific activity of each extract (nanomoles of ONPG hydrolyzed per minute and per milligram of protein at 37°C) by the protein concentration in the culture. OD, optical density.
FIG. 6
FIG. 6
STRE sites on the promoter regions of Msn2/4p-dependent genes. The STRE sites (CCCCT, black arrowheads) found up to 1,000 bp upstream of the ATG of each gene in the Saccharomyces genome database from the genomic DNA of strain S288C are indicated. Each vertical bar indicates the end of the intergenic region when it is less than 1,000 bp. PDS sites (CCCT) present upstream of the GDH3 and ALD5 open reading frames and the functional PDS site of the SSA3 gene are indicated by grey arrowheads.

References

    1. Bataillé N, Régnacq M, Boucherie H. Induction of a heat-shock-type response in Saccharomyces cerevisiae following glucose limitation. Yeast. 1991;7:367–378. - PubMed
    1. Boorstein W R, Craig E A. Regulation of a yeast HSP70 by a cAMP responsive transcriptional control element. EMBO J. 1990;9:2543–2553. - PMC - PubMed
    1. Boucherie H. Protein synthesis during transition and stationary phases under glucose limitation. J Bacteriol. 1985;161:385–392. - PMC - PubMed
    1. Boucherie H, Dujardin G, Kermogant M, Monribot C, Slonimsky P, Perrot M. Two dimensional protein map of Saccharomyces cerevisiae: construction of a gene-protein index. Yeast. 1995;11:601–613. - PubMed
    1. Boucherie H, Sagliocco F, Joubert R, Maillet I, Labarre J, Perrot M. Two-dimensional gel protein data of Saccharomyces cerevisiae. Electrophoresis. 1996;17:1683–1699. - PubMed

Publication types

MeSH terms

LinkOut - more resources