. 1998 Mar 1;160(5):2145-57.

CD40 ligand and appropriate cytokines induce switching to IgG, IgA, and IgE and coordinated germinal center and plasmacytoid phenotypic differentiation in a human monoclonal IgM+IgD+ B cell line

Affiliations

CD40 ligand and appropriate cytokines induce switching to IgG, IgA, and IgE and coordinated germinal center and plasmacytoid phenotypic differentiation in a human monoclonal IgM+IgD+ B cell line

A Cerutti et al. J Immunol. .

Abstract

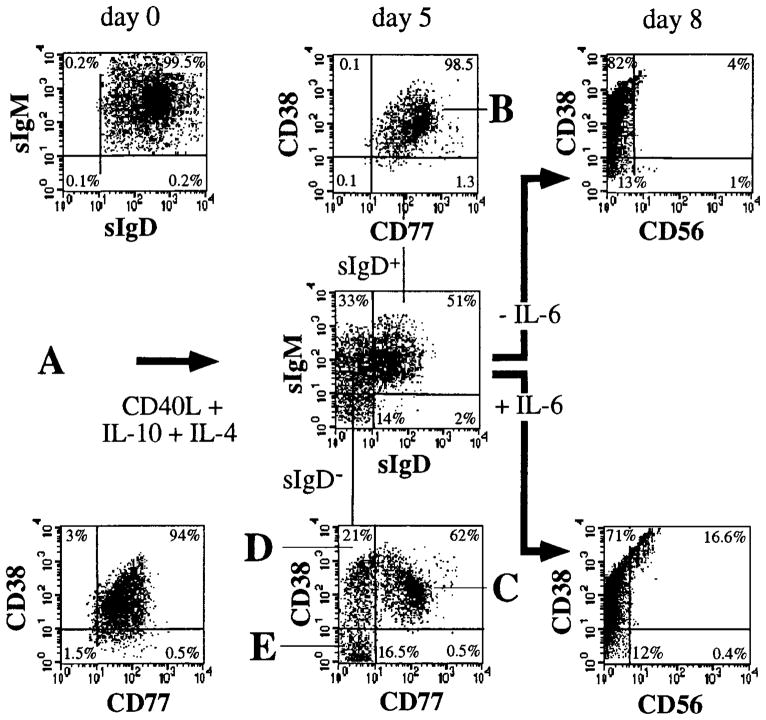
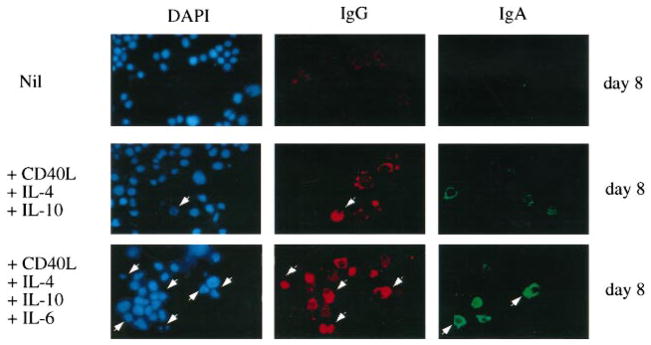
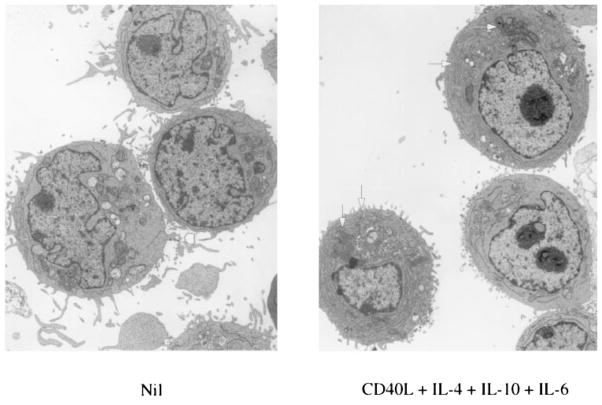
B lymphocytes are induced to undergo Ig class switching and a complex phenotypic differentiation by the milieu of the germinal center. Partly as a result of the lack of a suitable in vitro B cell model, the relationship between these processes in the humans has never been formally established in vitro. We have identified a human monoclonal B cell line, CL-01, that expresses surface IgM and IgD and, upon induction with CD40 ligand, IL-4, and IL-10, switches to all seven downstream isotypes, showing typical DNA switch recombination preceded by germline transcription of targeted CH regions. In CL-01 cells, switch-inducing stimuli trigger concomitant changes in expression of surface IgD, CD23, CD38, and CD77 that parallel those reported in ex vivo isolated tonsillar centroblasts, centrocytes, and memory B cells. Eventually, in the presence of IL-6, CL-01 cells express CD56 and accumulate cytoplasmic IgG and IgA, both traits of plasmacytoid differentiation. Analysis of transcription and recombination of the Ig H locus in sorted CL-01 cells suggest that Ig class switching begins in centroblasts, it extends to all isotypes in centrocytes, and it is extinct in memory B cells. Thus, we have induced coordinated Ig class switching, progression through germinal center phenotypic stages, and differentiation to memory B cells and plasma cells at the level of a single B clonotype. Our data suggest that these processes are likely regulated by a common maturation program, the activation of which may require CD40 ligand, IL-4, IL-10, and IL-6 only.


Figures

FIGURE 1
FIGURE 1
Schematic diagram depicting the strategy used to detect reciprocal DNA recombination products. The arrows indicate the relative position and the direction of the nested PCR primers used to amplify the switch junctions in deleted DNA circles. The DNA probe pairs used for the positive identification of the switch circle are depicted as black boxes below each nested PCR product. S, switch region; I, I exon; C, constant region.
FIGURE 2
FIGURE 2
Fluorescence flow cytometric analysis of the expression of sIgM, sIgG, sIgA, and sIgE by CL-01 cells and analysis of secreted IgM, IgG, IgA, and IgE. Dot plots depict the expression of sIgM, sIgD, sIgG, and sIgA by CL-01 cells (day 0) and by CL-01 cells cocultured with CD40L-293 cells and IL-4 (100 U/ml) for 5 or 8 days. Numbers inside quadrants are percentages of the total cells. Results are representative of three independent experiments. Histograms show the concentration of IgM (■), IgG ( formula image
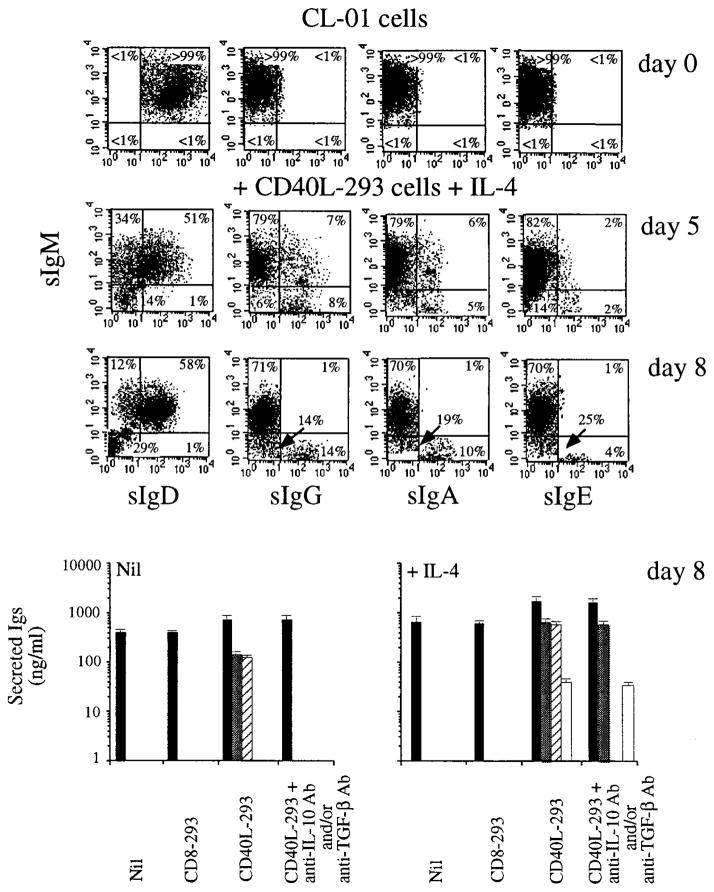
), IgA (▨), and IgE (□) accumulated in the fluids of CL-01 cells incubated for 8 days with or without IL-4, and cultured alone, with CD8-293 cells, with CD40L-293 cells, and with CD40L-293 cells in the presence of neutralizing anti-IL-10 and/or anti-TGF-β Abs (the concentrations of IgM and IgE were from cultures with both anti-IL-10 and anti-TGF-β Abs, whereas the concentrations of IgG and IgA were from cultures with anti-IL-10 and anti-TGF-β Abs, respectively). Values are mean ± SD of four determinations from three independent experiments.
FIGURE 3
FIGURE 3
Configuration of the Ig H chain locus in CL-01 cells. A, Schematic map of the human Ig H locus with the positions of the S regions (□), σ sequences (▤), JH and CH region exons ( formula image 
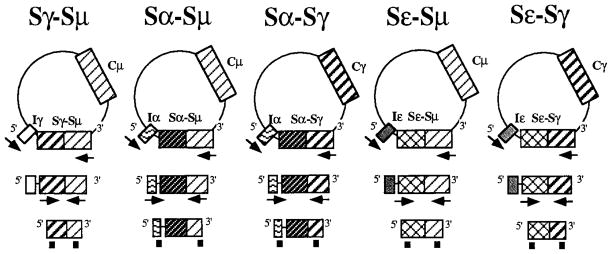
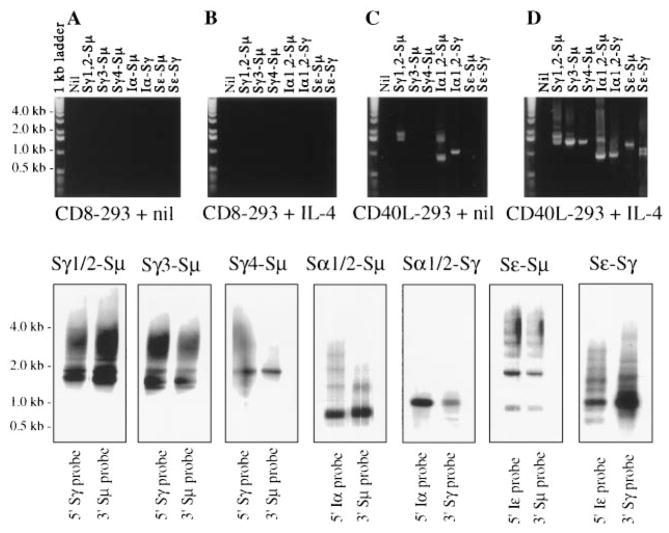
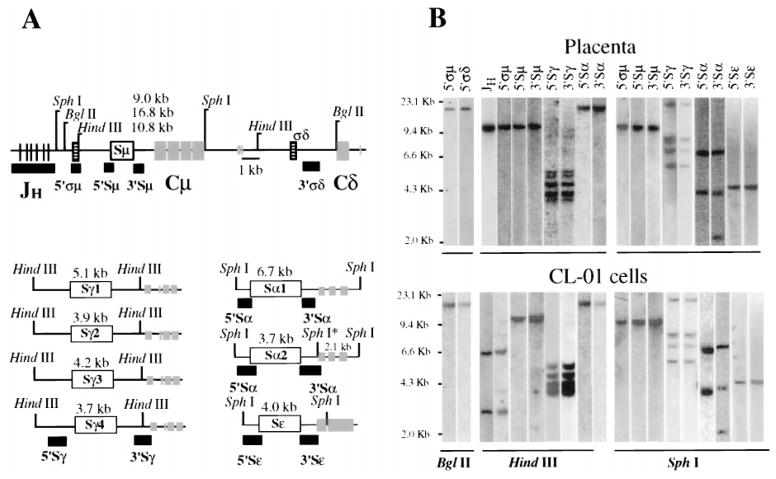
and lines), JH, 5′S, 3′S, and σ probes (■), and restriction sites. The expected sizes of restriction fragments detected by each switch probe are also indicated. The asterisk indicates a SphI site that is present in the 3′ end of the Sα2 locus, but not in the Sα1 locus. B, Genomic DNA from placenta (upper gel) and unstimulated CL-01 cells (bottom gel) was digested with BglII, HindIII, and SphI restriction enzymes; subjected to electrophoresis on a 0.7% agarose gel; blotted; and probed sequentially with the various σμ, Sμ, σδ, Sγ, Sα, and Sε region probes (shown above each lane).
FIGURE 4
FIGURE 4
The germline IH-CH and productive VHDJH-CH Ig transcripts in induced CL-01 cells. Fractionation of the germline and mature Ig transcript cDNA PCR amplified from CL-01 cells cocultured with CD8-293 cells only (A and E), CD8-293 cells and IL-4 (B and F), CD40L-293 cells only (C and G), or CD40L-293 cells and IL-4 (D and H) for 5 days (2% ethidium bromide-stained agarose gel). Gels were obtained from one of three independent experiments yielding similar results.
FIGURE 5
FIGURE 5
Identification of extrachromosomal reciprocal DNA recombination products in induced CL-01 cells. Fractionation of the Sγ1,2-Sμ, Sγ3-Sμ, Sγ4-Sμ, Sα-Sμ, Sα-Sγ, Sε-Sμ, and Sε-Sγ extrachromosomal reciprocal DNA recombination products PCR amplified from the genomic DNA of CL-01 cells cocultured with CD8-293 cells only (A), with CD8- 293 cells and IL-4 (B), with CD40L-293 cells only (C), or with CD40L-293 cells and IL-4 (D) for 5 days (0.8% ethidium bromide-stained agarose gel). Bottom panels, Southern blot analysis of the Sγ1/2-Sμ, Sγ3- Sμ, Sγ4-Sμ, Sα1/2-Sμ, Sα1/2-Sγ, Sε-Sμ, and Sε-Sγ extrachromosomal reciprocal recombination DNAs specifically amplified from CL-01 cells induced by CD40L-293 cells and IL-4, and hybridized with [γ-32P]dCTP probes as listed at the top of each panel.
FIGURE 6
FIGURE 6
Phenotypic GC and plasmacytoid differentiation in induced CL-01 cells. The expression of sIgM, sIgD, CD38, and CD77 was analyzed by double fluorescence in unstimulated CL-01 cells, which were referred to as at stage A (sIgM+sIgD+CD77+CD38+). After 5 days of culture with CD40L-293 cells, IL-4, and IL-10, almost one-half of the CL-01 cells (center panel, cells in the upper and left quadrants; see also Fig. 1, day 5, left panel) down-regulated or lost sIgM and completely lost sIgD, a hallmark of the transition from naive to GC B cells. Similar cells at day 5 were submitted to triple fluorescence to analyze the expression of CD38 and CD77 by the sIgD+ and sIgD CL-01 fractions, as defined by appropriate electronic gating, and were segregated in stages B (sIgMlowsIgDlowCD77+CD38+), C (sIgMlow/−sIgDCD77+CD38+), D (sIgMlow/−sIgDCD77CD38+), and E (sIgMlow/−sIgDCD77CD38). To verify the ability of CL-01 cells to undergo plasmacytoid differentiation, CL-01 cells stimulated with CD40L-293 cells, IL-4, and IL-10 for 5 days were cultured for additional 3 days with or without IL-6 and were analyzed for their expression of CD56 and CD38. The results depicted here were obtained from one of four experiments yielding similar results.
FIGURE 7
FIGURE 7
IL-6 induces plasmacytoid differentiation in IgG-switched CL-01 cells. CL-01 cells were incubated with medium only, with CD40L-293 cells, IL-4, and IL-10, and with CD40L-293 cells, IL-4, IL-10, and IL-6 for 8 days. IL-6 was added at day 5 of culture. 4′,6-Diamidine-2′-phenylindole dihydrochloride (blue), rhodamine-conjugated mouse Abs to human IgG (red), and FITC-conjugated mouse mAb to human IgA were used to visualize cellular nuclei, IgG, and IgA, respectively. Arrows indicate CL-01 cells that show accumulation of cIgG and cIgA as well as plasmacytoid morphology (×1000). Data were obtained from one of four experiments yielding similar results.
FIGURE 8
FIGURE 8
Electron microscopic analysis of CL-01 cells cultured for 8 days in the presence or in the absence of CD40L-293 cells, IL-4, IL-10, and IL-6. Arrows indicate the presence of ultrastructural plasmacytoid features, including parallel arrays of rough endoplasmic reticulum, and aggregates of mitochondrias (×11,800).
FIGURE 9
FIGURE 9
Transcriptional and recombinational status of the IgH chain locus in CL-01 cells at different stages of phenotypic differentiation. CL-01 cells were cultured with CD40L-293 cells, IL-4, and IL-10 for 5 days. Germline IH-CH and productive VHDJH-CH μ, γ1, γ2, γ3, γ4, α1, α2, and ε transcripts were amplified by PCR from cells at stages A (sIgM+sIgD+CD77+CD38+), B (sIgMlow/−sIgDlowCD77+CD38+), C (sIgMlow/−sIgDCD77+CD38+), D (sIgMlow/−sIgD+CD77+CD38+), and E (sIgMlow/−sIgDCD77CD38), as defined in Figure 6. The different cell fractions were segregated on the basis of their surface expression of sIgD, CD38, and CD77. The results depicted here were obtained from one of two independent experiments yielding similar results.
FIGURE 10
FIGURE 10
FR3-CDR3-FR4 sequences of the Ig VHDJH-Cμ, Cγ1, -Cγ2, -Cγ3, -Cγ4, -Cα1, -Cα2, and -Cε productive transcripts from CL-01 cells cultured with CD40L-293 cells, IL-4, and IL-10 for 5 days. The top sequence of each cluster is used as the term of comparison. Dashes indicate identities. The solid line above the first cluster depicts CDR3. The full dot indicates the beginning of the CH1 exon (residue −1). The sequences of the sense FR3 and antisense Cμ and Cε primers are underlined. The antisense Cγ1, Cγ2, Cγ3, Cγ4, Cα1, and Cα2 primers encompassed the sequences spanning nucleotides −285 to −308, −283 to −308, −282 to −308, −283 to −306, −772 to −796, and −758 to −783, respectively, and are not shown.
FIGURE 11
FIGURE 11
Expression of naive and GC markers by CL-01 cells at stages A, B, C, D, and E. Naive (CD23, CD24, CD39, CD44, and bcl-2), and GC (CD10, CD71, CD80, CD86, and CD95) B cell markers were analyzed on cells from fractions A (sIgM+sIgD+CD77+CD38+), B (sIgMlow/−sIgDlowCD77+CD38+), C (sIgMlow/−sIgDCD77+CD38+), D (sIgMlow/−sIgDCD77CD38+), and E (sIgMlow/−sIgDCD77CD38), that were isolated as described in Materials and Methods. The solid histograms were obtained using the mAb under study, and the dotted histograms were obtained using the respective isotype-matched control mAb with indifferent binding activity. Histograms were obtained from one of two independent experiments yielding similar results.

References

    1. MacLennan IC. Germinal centers. Annu Rev Immunol. 1994;12:117. - PubMed
    1. Pascual V, Liu YJ, Magalski A, de Boutellier O, Banchereau J, Capra JD. Analysis of somatic mutation in five B cell subsets of human tonsils. J Exp Med. 1994;180:329. - PMC - PubMed
    1. Liu YL, Malisan F, de Bouteiller O, Guret C, Lebecque S, Banchereau J, Mills FC, Max EE, Martinez-Valdez H. Within germinal centers, isotype switching of immunoglobulin genes occurs after the onset of somatic mutation. Immunity. 1996;4:241. - PubMed
    1. Merville P, Déchanet J, Desmoulière A, Durand I, de Boutellier O, Garrone P, Banchereau J, Liu YJ. Bcl-2+ tonsillar plasma cells are rescued from apoptosis by bone marrow fibroblasts. J Exp Med. 1996;183:227. - PMC - PubMed
    1. Punnonen J, Aversa G, Cocks BG, McKenzie AN, Menon S, Zurawski G, de Waal Malefyt R, de Vries JE. Interleukin 13 induces interleukin 4-independent IgG4 and IgE synthesis and CD23 expression by human B cells. Proc Natl Acad Sci USA. 1993;90:3730. - PMC - PubMed

Publication types

MeSH terms