. 1998 Mar;72(3):1931-40.
doi: 10.1128/JVI.72.3.1931-1940.1998.

Competition for DNA binding sites between the short and long forms of E2 dimers underlies repression in bovine papillomavirus type 1 DNA replication control

Affiliations

Competition for DNA binding sites between the short and long forms of E2 dimers underlies repression in bovine papillomavirus type 1 DNA replication control

D A Lim et al. J Virol. 1998 Mar.

Abstract

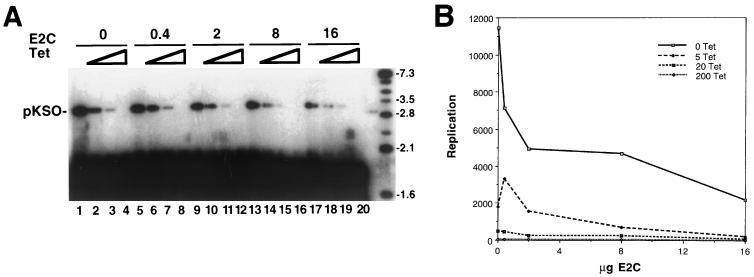
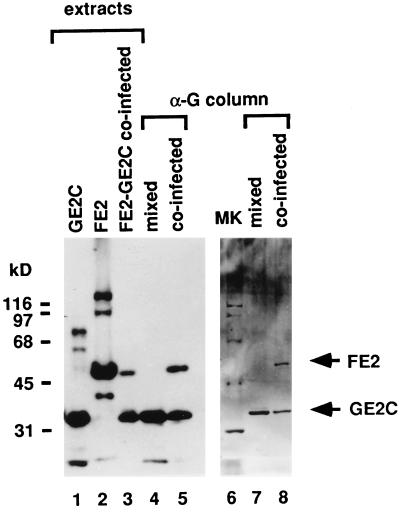
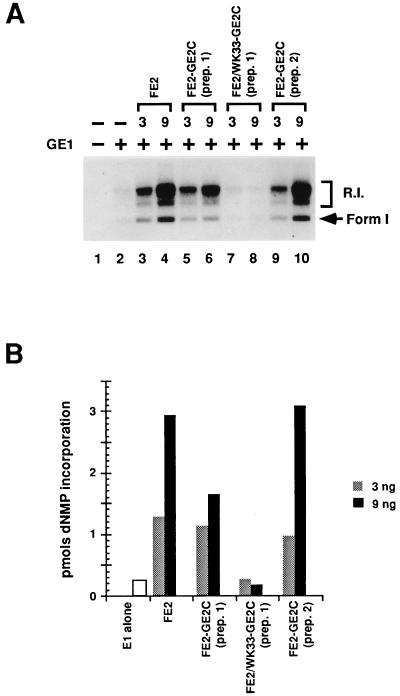
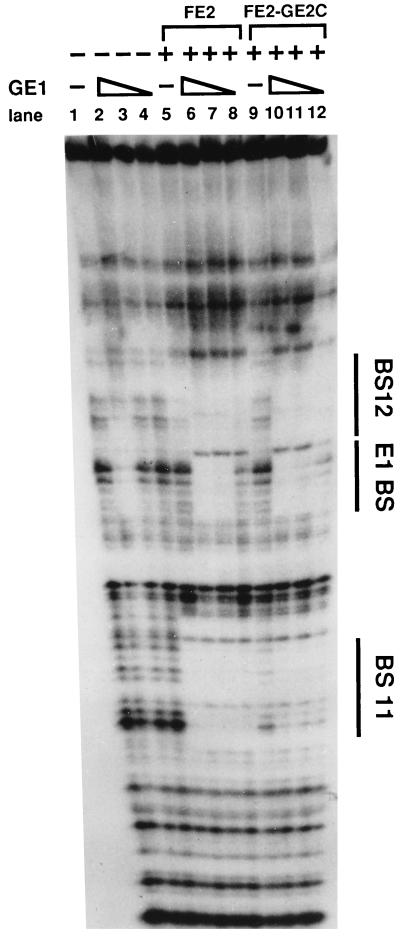
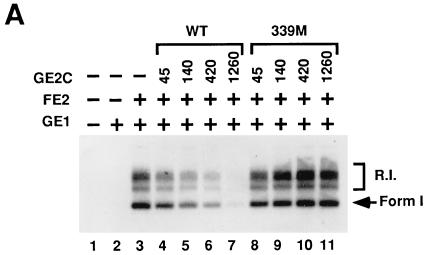
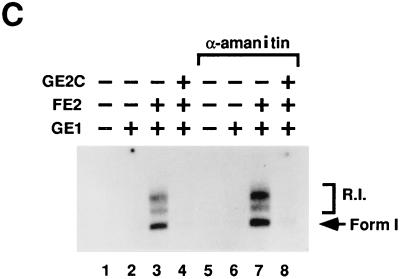
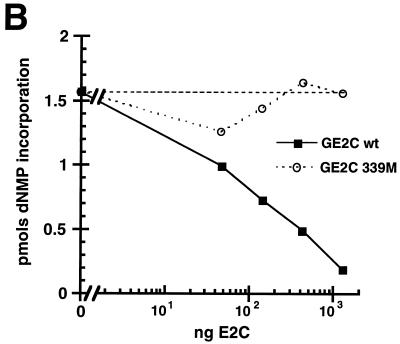
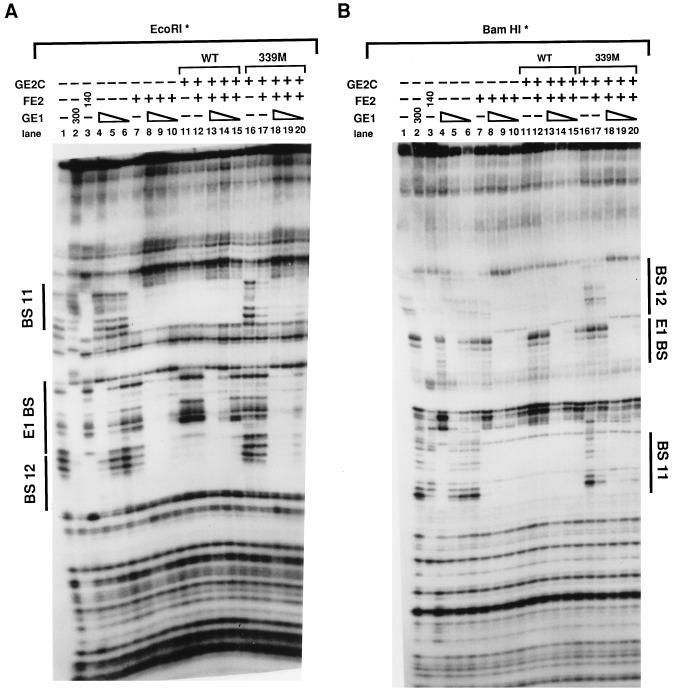
Papillomaviruses establish a long-term latency in vivo by maintaining their genomes as nuclear plasmids in proliferating cells. Bovine papillomavirus type 1 encodes two proteins required for viral DNA replication: the helicase E1 and the positive regulator E2. The homodimeric E2 is known to cooperatively bind to DNA with E1 to form a preinitiation complex at the origin of DNA replication. The virus also codes for two short forms of E2 that can repress viral functions when overexpressed, and at least one copy of the repressor is required for stable plasmid maintenance in transformed cells. Employing a tetracycline-regulated system to control E1 and E2 production from integrated loci, we show that the short form of E2 negatively regulates DNA replication. We also found that the short form could repress replication in a cell-free replication system and that the repression requires the DNA binding domain of the protein. In contrast, heterodimers of the short and long forms were activators and, by footprint analysis, were shown to be as potent as homodimeric E2 in loading E1 to its cognate site. DNA binding studies show that when E1 levels are low and are dependent upon E2 for occupancy of the origin site, the repressor can block E1-DNA interactions. We conclude that DNA replication modulation results from competition between the different forms of E2 for DNA binding. Given that heterodimers are active and that the repressor form of E2 shows little cooperativity with E1 for DNA binding, this protein is a weak repressor.


Figures

FIG. 1
FIG. 1
Replication of BPV is regulated by E1 and E2 levels and is negatively modulated by E2C in vivo. The pKSO reporter was transfected into CHO cells that have E1 and E2 genes regulated by tetracycline. The amplification of the reporter under all conditions was monitored by DNA blot analysis at 3 days posttransfection after DNAs were linearized and treated with DpnI to degrade unreplicated reporter. (A) Autoradiogram of the blot hybridized with labeled pKSO probe. Triangles indicate increasing concentration of tetracycline in the medium, i.e., 0, 20, 50, and 200 ng/ml for lanes 1, 2, 3, and 4, respectively. This order was followed for each set of experiments with an increased E2C concentration. The amounts (in micrograms) of the pCMVE2C vector used are shown at the top. The levels of E1 and E2 in this expression system are inversely related to the tetracycline concentration. Repression under equivalent tetracycline induction can be followed, for example, by comparing the signals in lanes 1, 5, 9, 13, and 17. Markers in rightmost lane are molecular size standards. Numbers indicate sizes in kilobases. (B) Replication measured in arbitrary units was plotted by using PhosphorImager readouts from the linear DNA positions shown in panel A. The data show how the signals compared under identical tetracyline levels (0 to 200 ng of tetracycline [Tet]/ml) as a function of input E2C vector. Similar data were obtained in another independent experiment (data not shown).
FIG. 2
FIG. 2
Purification of FE2-GE2C heterodimers. Full-length FE2 is not retained on the α-Glu (α-G) monoclonal antibody column. Lanes 1 to 5 show an autoradiographic film of an SDS–12% PAGE enhanced chemiluminescence Western blot probed with the E2-specific B202 monoclonal antibody. Lanes 6 to 8 show a silver-stained SDS–12% PAGE gel containing purified preparations. Whole-cell extracts of singly infected Sf9 cells expressing GE2C (lane 1) and FE2 (lane 2) and of coinfected cells expressing both FE2 and GE2C (lane 3) are shown. Some unreduced protein appears in the extract preparation as well as degradation products of E2, but in all cases the major band in the extracts is either E2 or E2C. The purified material is homogeneous. Proteins retained by the α-Glu column from a mixture of GE2C and FE2 extracts (lanes 4 and 7) and from an FE2-GE2C coinfected extract (lanes 5 and 8) are also shown. Arrows indicate the mobilities of FE2 and GE2C. Lane 6, molecular mass standards (in kilodaltons shown at left).
FIG. 3
FIG. 3
Heterodimer preparations of FE2-GE2C stimulate in vitro replication. (A) Autoradiogram detecting in vitro DNA replication products fractionated by agarose gel electrophoresis. The amount of GE1 in the indicated reactions (+) was 125 ng per standard reaction volume. The amount (in nanograms) of homo- or heterodimer preparation added to each reaction is indicated in the top row. Supercoiled DNA products (arrow, Form 1) and replication intermediates (R.I.) are indicated at the right. Lane 1, background extract synthesis; lane 2, E1-only replication. (B) PhosphorImager quantitation of the data in panel A. The total number of counts for each lane was obtained and converted to picomoles of synthesis by comparison to a standard. dNMP, deoxynucleoside monophosphate.
FIG. 4
FIG. 4
FE2-GE2C heterodimer preparations enhance E1 DNA binding at the origin. The results of a DNase I protection assay using the BPV-1 origin fragment (nucleotides 7805 to 100) are shown. BS11 and BS12 are the E2 binding sites that flank the E1 binding site (E1BS). The triangles indicate serial dilutions of GE1 (100, 30, and 10 ng). Standard DNase I digestion reactions were carried out in the presence (+) and absence (−) of FE2 (40 ng) or FE2-GE2C (50 ng). A characteristic of the E2-E1 complex on this strand is the DNase I hypersensitive site between BS12 and E1BS; this site is not found in the E1-only footprint.
FIG. 5
FIG. 5
E2C homodimers inhibit E1-E2-dependent replication in vitro. (A) Autoradiogram detecting in vitro DNA replication products after gel electrophoresis of the products. The amount of GE1 in the indicated reactions (+) was 80 ng per standard reaction volume. The amount of FE2 in the indicated reactions (+) was 10 ng. The titrations of wild-type (WT) E2C and mutant 339M protein are noted at the top of the panel in nanograms. (B) PhosphorImager quantitation of replication data from panel A. The horizontal dashed line indicates the level of E1-E2 replication shown in panel A, lane 3. dNMP, deoxynucleoside monophosphate. (C) E2C inhibition of replication is resistant to α-amanitin. Detection of replication products in vitro was performed as described above. A total of 100 μg of α-amanitin/ml was added to each of the indicated reactions. The amounts of GE1 and FE2 in the indicated reactions (+) were identical to those in panel A; the amount of GE2C in the indicated reactions (+) was the same as that for panel A, lane 7. R.I., replication intermediates; Form 1, supercoiled DNA products.
FIG. 5
FIG. 5
E2C homodimers inhibit E1-E2-dependent replication in vitro. (A) Autoradiogram detecting in vitro DNA replication products after gel electrophoresis of the products. The amount of GE1 in the indicated reactions (+) was 80 ng per standard reaction volume. The amount of FE2 in the indicated reactions (+) was 10 ng. The titrations of wild-type (WT) E2C and mutant 339M protein are noted at the top of the panel in nanograms. (B) PhosphorImager quantitation of replication data from panel A. The horizontal dashed line indicates the level of E1-E2 replication shown in panel A, lane 3. dNMP, deoxynucleoside monophosphate. (C) E2C inhibition of replication is resistant to α-amanitin. Detection of replication products in vitro was performed as described above. A total of 100 μg of α-amanitin/ml was added to each of the indicated reactions. The amounts of GE1 and FE2 in the indicated reactions (+) were identical to those in panel A; the amount of GE2C in the indicated reactions (+) was the same as that for panel A, lane 7. R.I., replication intermediates; Form 1, supercoiled DNA products.
FIG. 6
FIG. 6
E2C can prevent the assembly of E1-E2 complexes at the origin. E1 and E2 occupancy of cognate sites was assayed by DNase I protection assay of the BPV-1 origin. End-labeled fragments were obtained for the bottom (A) and top (B) strands. Thus, results shown in panel B can be compared to those in Fig. 4. E1 and E2 binding sites are labeled as in the legend for Fig. 4. The triangles indicate serial dilutions of GE1 (100, 30, and 10 ng). Numbers in the rows above the lane numbers indicate nanogram amounts of protein. The amount of FE2 in the indicated reactions (+) was 20 ng; the amount of GE2C in the indicated reactions (+) was 200 ng.
FIG. 7
FIG. 7
E2 activation of DNA replication is dependent upon E2 binding sites in BPV or vector DNA. (A) Autoradiogram of fractionated DNA products from in vitro replication assays. The DNA template used in the reactions is indicated above the brackets. pCLOT does not contain the E2 binding sites. The amount of GE1 in the indicated reactions (+) was 80 ng. The amounts (nanograms) of FE2 and GE2C are indicated in their respective rows. R.I., replication intermediates; Form 1, supercoiled DNA products. (B) PhosphorImager quantitation of replication products shown in panel A. dNMP, deoxynucleoside monophosphate.

Similar articles

Cited by

References

    1. Barsoum J, Prakash S S, Han P, Androphy E J. Mechanism of action of the papillomavirus E2 repressor: repression in the absence of DNA binding. J Virol. 1992;66:3941–3945. - PMC - PubMed
    1. Berg M, Stenlund A. Functional interactions between papillomavirus E1 and E2 proteins. J Virol. 1997;71:3853–3863. - PMC - PubMed
    1. Bonne-Andrea C, Santucci S, Clertant P, Tillier F. Bovine papillomavirus E1 protein binds specifically DNA polymerase α but not replication protein A. J Virol. 1995;69:2341–2350. - PMC - PubMed
    1. Chang A C Y, Cohen S N. Construction and characterization of amplifiable multicopy DNA cloning vehicles derived from the P15A cryptic miniplasmid. J Bacteriol. 1978;134:1141–1156. - PMC - PubMed
    1. Cheng S, Schmidt-Grimminger D C, Mumat T, Broker T R, Chow L T. Differentiation-dependent up-regulation of the human papillomavirus E7 gene reactivates cellular DNA replication in suprabasal differentiated keratinocytes. Genes Dev. 1995;9:2335–2349. - PubMed

Publication types

MeSH terms

LinkOut - more resources