. 1998 Mar;72(3):2233-45.
doi: 10.1128/JVI.72.3.2233-2245.1998.

A 2.9-kilobase noncoding nuclear RNA functions in the establishment of persistent Hz-1 viral infection

Affiliations

A 2.9-kilobase noncoding nuclear RNA functions in the establishment of persistent Hz-1 viral infection

Y C Chao et al. J Virol. 1998 Mar.

Abstract

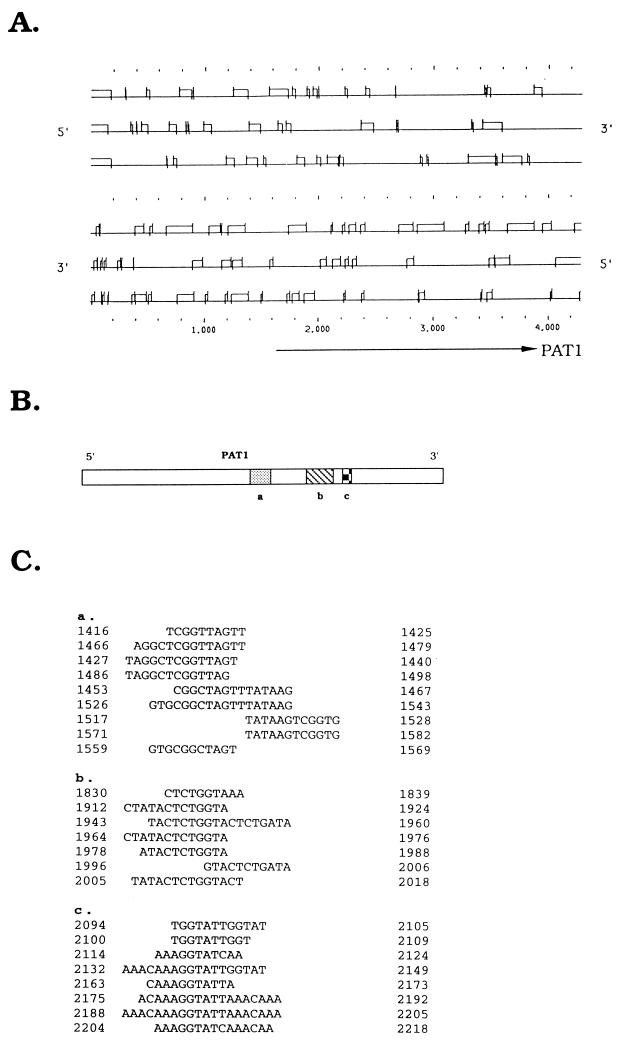
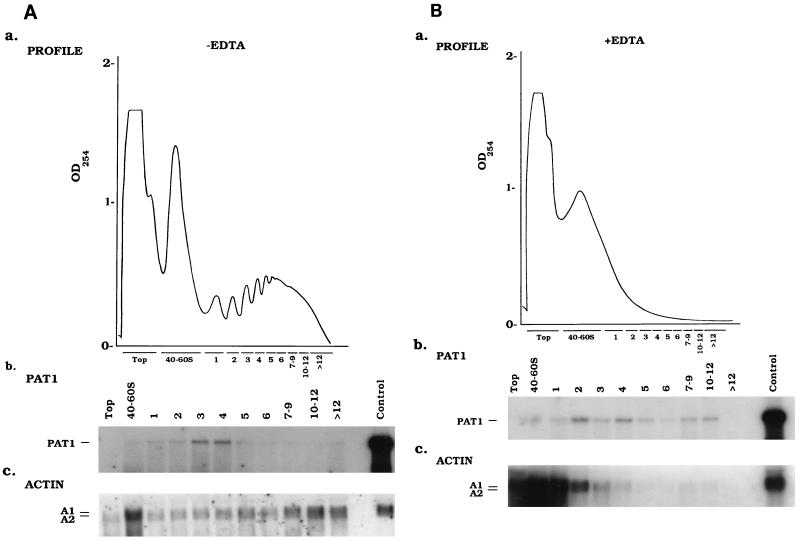
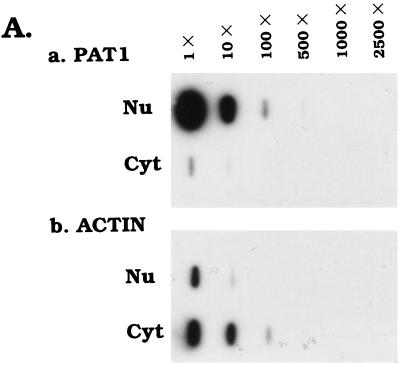
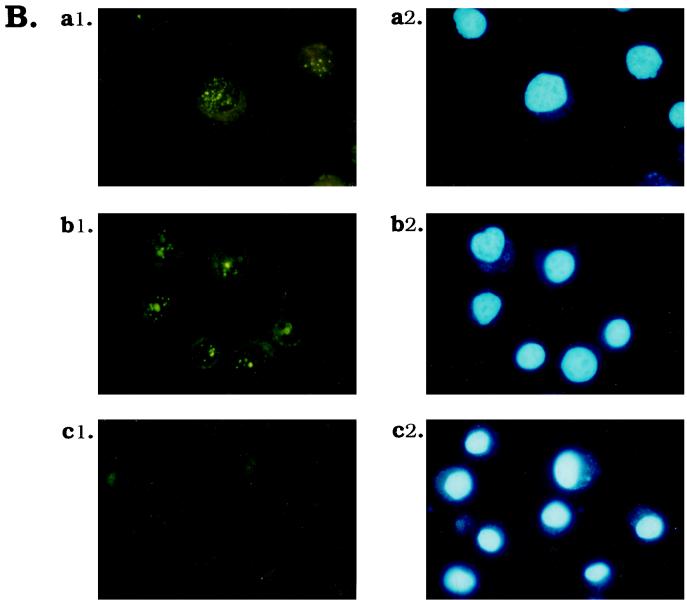
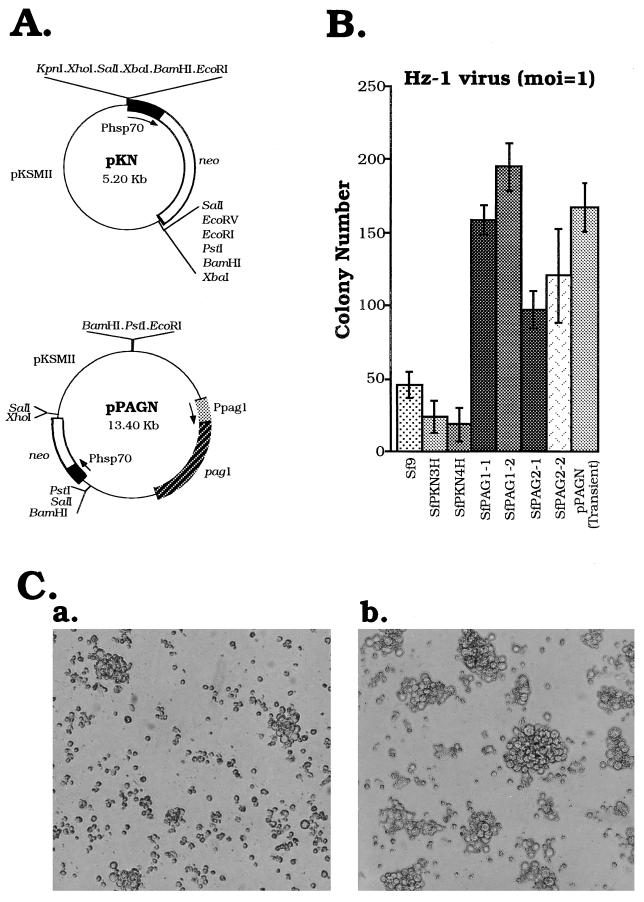
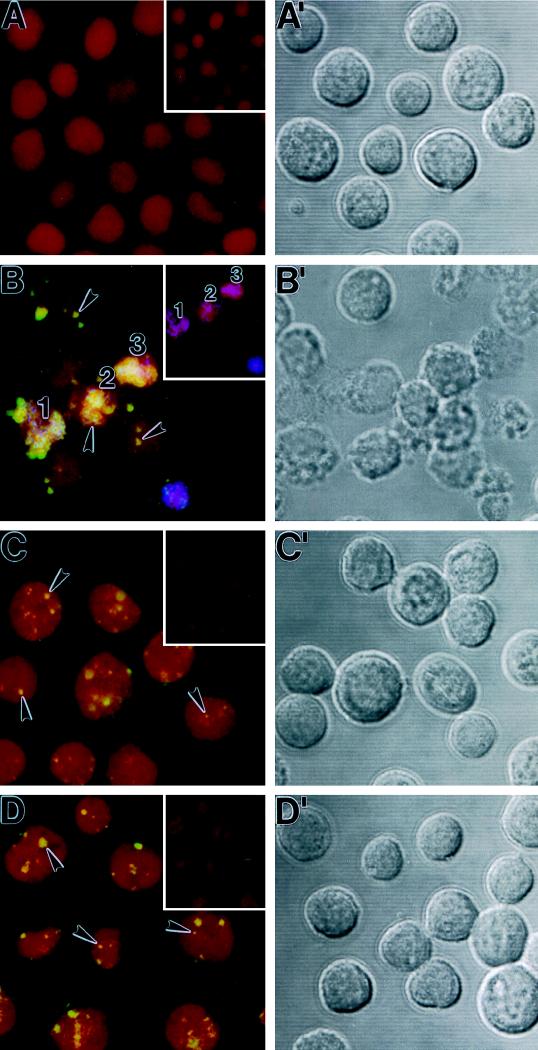
Differential viral gene expression during both productive and persistent infections of Hz-1 virus in insect cells was elucidated. Despite more than 100 viral transcripts being expressed during productive viral infection, massive viral gene shutoff was observed during viral persistency, leaving the 2.9-kb persistence-associated transcript 1 (PAT1) as the only detectable viral RNA. Persistence-associated gene 1 (pag1), which encodes PAT1, was cloned and found to contain no significant open reading frames. PAT1 is not associated with the cellular translation machinery and is located exclusively in the nucleus. Further experiments showed that PAT1 is functional in the establishment of persistent Hz-1 viral infection in the cells. All the evidence collectively indicates that PAT1 is a novel nuclear transcript of viral origin. Our results showed that although PAT1 and XIST RNA, a mammalian X-inactive specific transcript, are transcribed by different genes, they have interesting similarities.


Figures

FIG. 1
FIG. 1
Location and sequence of pag1. (A) Map and location of PAT1 coding region. The first line represents percentages of the viral genome, the EcoRI map of the linearized 228-kb Hz-1 viral genome (9) is shown in the second line, the KpnI map of the EcoRI-M fragment is shown in the third line, the region sequenced is shown in the fourth line, and the orientation and transcriptional region of PAT1 are shown in the fifth line. The letters above the lines denote the restricted viral DNA fragments, and those below the lines denote restriction sites (Kpn, KpnI; Eco, EcoRI). (B) Nucleotide sequence of pag1. The putative AP1 consensus sequence and putative GATA, CAAT, and TATA motifs are underlined. CAGT, the conserved transcription start sequence for baculovirus early genes, is boxed. The transcription start site is indicated by an arrow and the transcription termination site is marked by an asterisk. (C) Primer extension was used to determine the transcription start site of PAT1. Lanes 1 to 4, sequence ladders. The extended (78-bp) and the primer (35-bp) bands derived from the total RNAs extracted from productively infected TN368 cells (lane 5), persistently infected TNP3 cells (lane 6), and healthy parental TN368 cells (lane 7) are shown. (D) RNase protection was used to map the 3′ end of PAT1. A 32P-labeled RNA probe was transcribed by using T3 polymerase from subfragment C of viral EcoRI-M fragment. Before in vitro transcription, subfragment C was digested with restriction enzyme HpaI to generate an EcoRI-HpaI single-stranded antisense RNA probe (see panel A). Lanes 4 to 7, are sequence ladders. Three closely associated bands were protected for productively infected TN368 cells (lane 1) and persistently infected cells TNP3 (lane 2). The major protected 82-bp band is marked. No protection was observed for RNA extracted from uninfected TN368 cells (lane 3). nt, nucleotides.
FIG. 1
FIG. 1
Location and sequence of pag1. (A) Map and location of PAT1 coding region. The first line represents percentages of the viral genome, the EcoRI map of the linearized 228-kb Hz-1 viral genome (9) is shown in the second line, the KpnI map of the EcoRI-M fragment is shown in the third line, the region sequenced is shown in the fourth line, and the orientation and transcriptional region of PAT1 are shown in the fifth line. The letters above the lines denote the restricted viral DNA fragments, and those below the lines denote restriction sites (Kpn, KpnI; Eco, EcoRI). (B) Nucleotide sequence of pag1. The putative AP1 consensus sequence and putative GATA, CAAT, and TATA motifs are underlined. CAGT, the conserved transcription start sequence for baculovirus early genes, is boxed. The transcription start site is indicated by an arrow and the transcription termination site is marked by an asterisk. (C) Primer extension was used to determine the transcription start site of PAT1. Lanes 1 to 4, sequence ladders. The extended (78-bp) and the primer (35-bp) bands derived from the total RNAs extracted from productively infected TN368 cells (lane 5), persistently infected TNP3 cells (lane 6), and healthy parental TN368 cells (lane 7) are shown. (D) RNase protection was used to map the 3′ end of PAT1. A 32P-labeled RNA probe was transcribed by using T3 polymerase from subfragment C of viral EcoRI-M fragment. Before in vitro transcription, subfragment C was digested with restriction enzyme HpaI to generate an EcoRI-HpaI single-stranded antisense RNA probe (see panel A). Lanes 4 to 7, are sequence ladders. Three closely associated bands were protected for productively infected TN368 cells (lane 1) and persistently infected cells TNP3 (lane 2). The major protected 82-bp band is marked. No protection was observed for RNA extracted from uninfected TN368 cells (lane 3). nt, nucleotides.
FIG. 2
FIG. 2
DNA sequence analysis of pag1. (A) Computer ORF analysis of pag1. ORFs are indicated as open boxes. ATG initiation codons are indicated by a vertical line, and termination codons are indicated by a vertical line bisecting the horizontal. The orientations of the top three frames are the same as for PAT1. The orientations of the bottom three reading frames are opposite to those for PAT1. The transcriptional region of PAT1 is indicated by an arrow. (B) Relative locations of clustered repeats (a, b, and c) on PAT1. (C) Sequences and positions of three major clustered direct repeats (a, b, and c). Only those repeats larger than 10 bases are included.
FIG. 3
FIG. 3
Amplification of PAT1 cDNA fragments by RNA PCR. Overlapping fragments covering the entire 2.8-kb cDNA were amplified by using paired primers. Regions of the amplified fragments H, M, M1, M2, and T were sequenced. The experiments, from RNA PCR to sequencing, were repeated twice. The P fragment, which resides in the promoter region, was subjected to RNA PCR amplification to serve as a negative control.
FIG. 4
FIG. 4
Promoter activity analysis of pag1. (A) Transfection of pag1 into host cells, indicating that viral factors are not essential for PAT1 transcription by the pag1 promoter. Plasmid pHzE-M (10), which contains the entire pag1 gene, was transfected into Sf9 cells. Total RNAs were harvested and analyzed by Northern hybridization. PAT1 signals can be found at 4 and 8 h after transfection. Total RNAs harvested from parental TN368 cells and persistently infected TNP3 cells were also used as negative and positive controls, respectively. The probe used for this analysis was a gel-purified subfragment E derived from the viral genomic EcoRI-M fragment (see Fig. 1A). Numbers on the left are in kilobases. (B) Progressive deletion analysis at the 3′ end of the upstream regulatory region of pag1. These fragments were ligated with the protein-coding region of the luciferase gene, and the activity of this enzyme was determined after the transfection of the constructs into Sf9 cells. All of the constructs were cotransfected with another construct containing a Drosophila actin promoter-driven CAT gene as an internal control. Data (means ± standard deviations) were collected from triplicate assays in three independent experiments. (C) Progressive deletion analysis at the 5′ end of the upstream regulatory region of pag1. All the fragments ended at +29 bp and were ligated with the protein-coding region of the lacZ gene. CAAT, GATA (TTATC), and TATA motifs are shown. Following transfection of the constructs into Sf9 cells, LacZ activities were determined. All of the constructs were cotransfected with a construct containing a Drosophila actin promoter-driven CAT gene to serve as negative controls. One unit of LacZ activity is equal to the intensity emitted by 0.1 nM 4-methylumbelliferone. Data (means ± standard deviations) were collected from triplicate assays in three independent experiments.
FIG. 5
FIG. 5
Polysome fractionation of persistently infected TNP3 cells. (A) Postmitochondrial lysates collected from 107 persistently infected TNP3 cells were subjected to sucrose gradient centrifugation. (a) Profile of optical density at 254 nm of postmitochondrial lysates. Each fraction was then collected and analyzed by Northern hybridization with either a pag1 (b) or actin (c) probe. One-tenth of the total RNA extracted from 107 TNP3 cells was loaded into the control lanes prior to fractionation to serve as a control. (B) (a) Ribosome knockout by EDTA treatment in the polysome fractionation experiment. A profile of the optical density at 254 nm of the gradient isolated from 107 cells (a) and Northern analysis of each fraction with either a pag1 (b) or an actin (c) probe are shown. One-tenth of the total RNA extracted from 107 TNP3 cells was loaded into the control lanes prior to fractionation to serve as a control. The probe used for pag1 hybridization was the same as in Fig. 4A, and the actin probe used was the 0.6-kb BglII/SalI subfragment of the original 1.8-kb Bombyx mori actin clone in pGem (32).
FIG. 6
FIG. 6
PAT1 is localized in the nucleus. (A) Slot blots of nuclear (Nu) and cytoplasmic (Cyt) RNAs from persistently infected TNP3 cells. Slot blots with a series of 10× dilutions of nuclear and cytoplasmic RNAs start from 5 μg per slot. The blots were hybridized with a pag1 (a) or actin (b) probe. The pag1 and actin probes used for this analysis were the same as for Fig. 5. (B) Fluorescent in situ hybridization showing that PAT1 is localized in the nucleus. (a1, b1, and c1) PAT1 fluorescent in situ hybridization of persistently infected SfP2 cells, stably pag1-transfected SfPAG1-1 cells, and parental Sf9 cells, respectively. (a2, b2, and c2) DAPI-stained nuclei of the cells in panels a1, b1, and c1, respectively.
FIG. 6
FIG. 6
PAT1 is localized in the nucleus. (A) Slot blots of nuclear (Nu) and cytoplasmic (Cyt) RNAs from persistently infected TNP3 cells. Slot blots with a series of 10× dilutions of nuclear and cytoplasmic RNAs start from 5 μg per slot. The blots were hybridized with a pag1 (a) or actin (b) probe. The pag1 and actin probes used for this analysis were the same as for Fig. 5. (B) Fluorescent in situ hybridization showing that PAT1 is localized in the nucleus. (a1, b1, and c1) PAT1 fluorescent in situ hybridization of persistently infected SfP2 cells, stably pag1-transfected SfPAG1-1 cells, and parental Sf9 cells, respectively. (a2, b2, and c2) DAPI-stained nuclei of the cells in panels a1, b1, and c1, respectively.
FIG. 7
FIG. 7
The pag1 gene functions in the establishment of persistent viral infection. (A) Map of the plasmids as it appeared in this experiment. Arrows indicate the regions of the promoters and their directions of gene expression. Phsp70, hsp70 promoter; Ppag1, pag1 promoter; neo, neomycin resistance gene; pag1, PAT1 coding region; pKSMII, bacterial plasmid vector (Stratagene). (B) Generation of persistently infected clones by Hz-1 virus infection in the parental and stably pag1-transfected cells. Sf9, untransfected host cells. SfPKN3H and SfPKN4H are two cell lines stably transfected with only the neomycin resistance gene. The stably pag1-transfected clones, SfPAG1-1, SfPAG1-2, SfPAG2-1, and SfPAG2-2, were established from different transfection experiments. Sf9 cells transiently transfected with plasmids containing pag1 (pPAGN) were also tested. In these experiments, cells (4 × 10⁴) were challenged with Hz-1 virus, and the numbers of surviving persistently infected cell clones were calculated. Data (means ± standard deviations) were collected from triplicate assays of three independent viral infection experiments. (C) Colonies which were established by the infection of Hz-1 virus in the parental Sf9 cells (a) and the stably pag1-transfected SfPAG1-1 cells (b).
FIG. 8
FIG. 8
Simultaneous detection of viral DNA and antigens in the Sf cells. Cells were hybridized with a 0.3-kb probe derived from the viral genomic HindIII-K fragment and then labeled with an antibody against Hz-1 virus. (A and A′) Uninfected Sf9 cells; (B and B′) Sf9 cells infected by Hz-1 virus; (C and C′) persistently infected SfP2 cells; (D and D′) mixture of cloned cells established by the infection of SfPAG-1-1 cells with Hz-1 virus. (A to D) Images of double DNA and antigen detections; (A′ to D′) bright-field photographs of cells prepared in parallel, corresponding to panels A to D, respectively. Some of the Hz-1 viral DNAs (green) are indicated by arrowheads to assist identification. The host chromosomes (red) were stained with providium iodide. When these two stains overlapped, the viral DNA signal becomes yellow. Viral antigen was stained with Cy5 (pink to purple, depending on the overlapping dyes resulting from the other signals). The insets in panels A to D are the overlapping colors of only two images, propidium iodide and Cy5, to show the positions and intensities of viral antigens in different cells. Numbers 1 to 3 in panel B indicate some of the cells with labeled signals of viral antigen.

References

    1. Blissard G W, Kogan P H, Wei R, Rohrmann G F. A synthetic early promoter from a baculovirus: roles of the TATA box and conserved start site CAGT sequence in basal levels of transcription. Virology. 1992;190:783–793. - PubMed
    1. Blissard G W, Rohrmann G F. Baculovirus diversity and molecular biology. Annu Rev Entomol. 1990;35:127–155. - PubMed
    1. Block T M, Spivack J G, Steiner I, Deshmane S, McIntosh M T, Lirette R P, Fraser N W. A herpes simplex virus type 1 latency-associated transcript mutant reactivates with normal kinetics from latent infection. J Virol. 1990;64:3417–3426. - PMC - PubMed
    1. Brockdorff N, Ashworth A, Graham F K, McCabe V M, Norris D P, Cooper P J, Swift S, Rastan S. The product of the mouse XIST gene is a 15 kb inactive X specific transcript containing no conserved ORF and located in the nucleus. Cell. 1992;71:515–526. - PubMed
    1. Brown C J, Hendrich B D, Rupert J L, Lafreniere R G, Xing Y, Lawrence J, Willard H F. The human XIST gene: analysis of a 17 kb inactive X-specific RNA that contains conserved repeats and is highly localized within the nucleus. Cell. 1992;71:527–542. - PubMed

Publication types

MeSH terms

Associated data

LinkOut - more resources