. 1998 Mar 1;12(5):627-39.
doi: 10.1101/gad.12.5.627.

Histone acetyltransferase activity of yeast Gcn5p is required for the activation of target genes in vivo

Affiliations

Histone acetyltransferase activity of yeast Gcn5p is required for the activation of target genes in vivo

M H Kuo et al. Genes Dev. .

Abstract

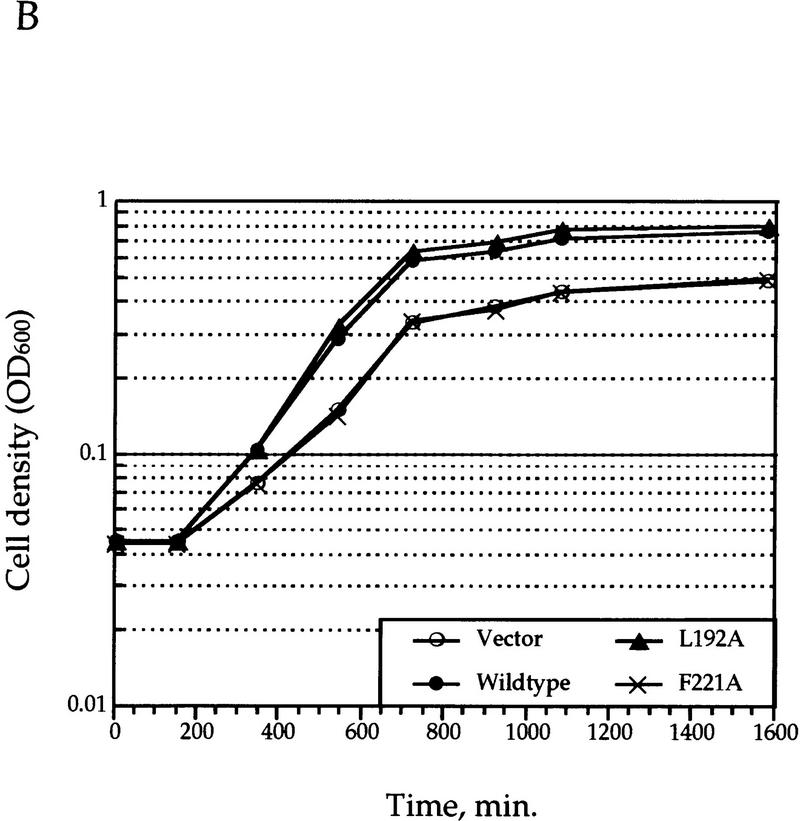
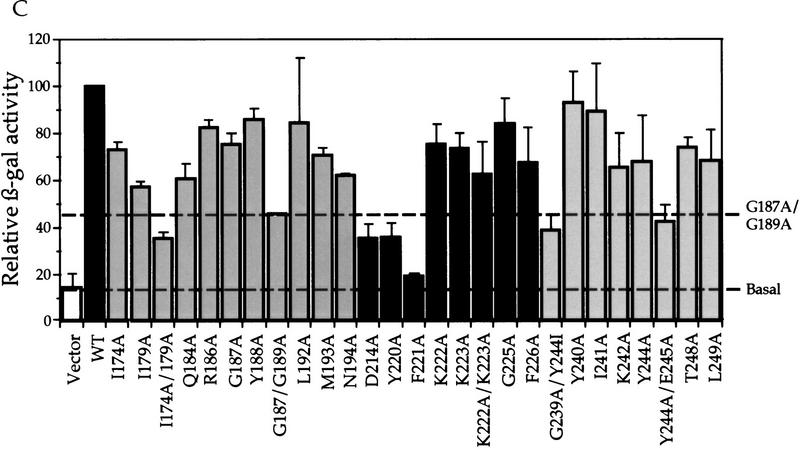
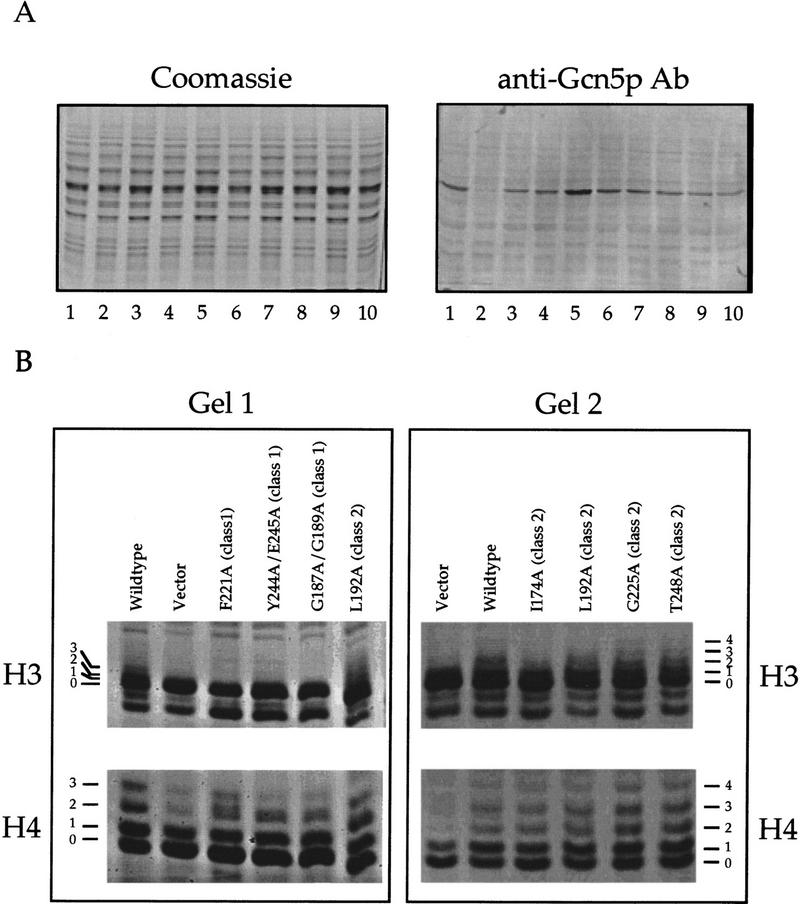
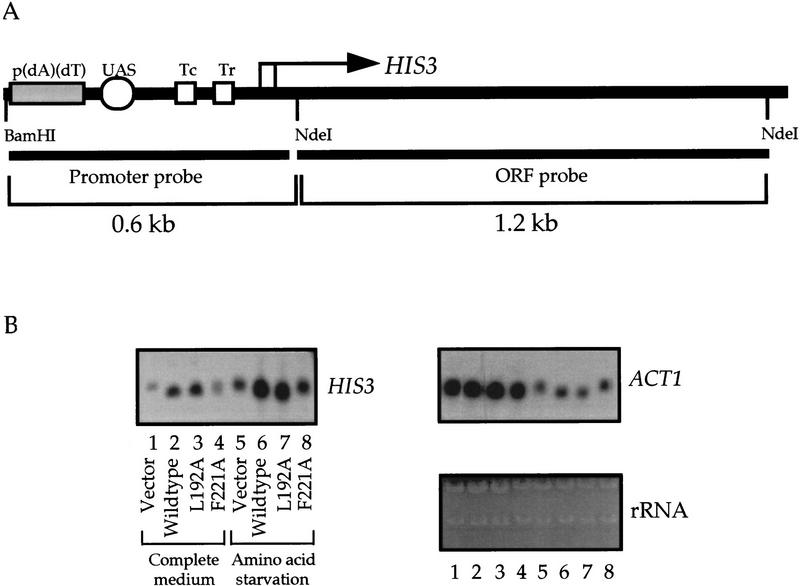
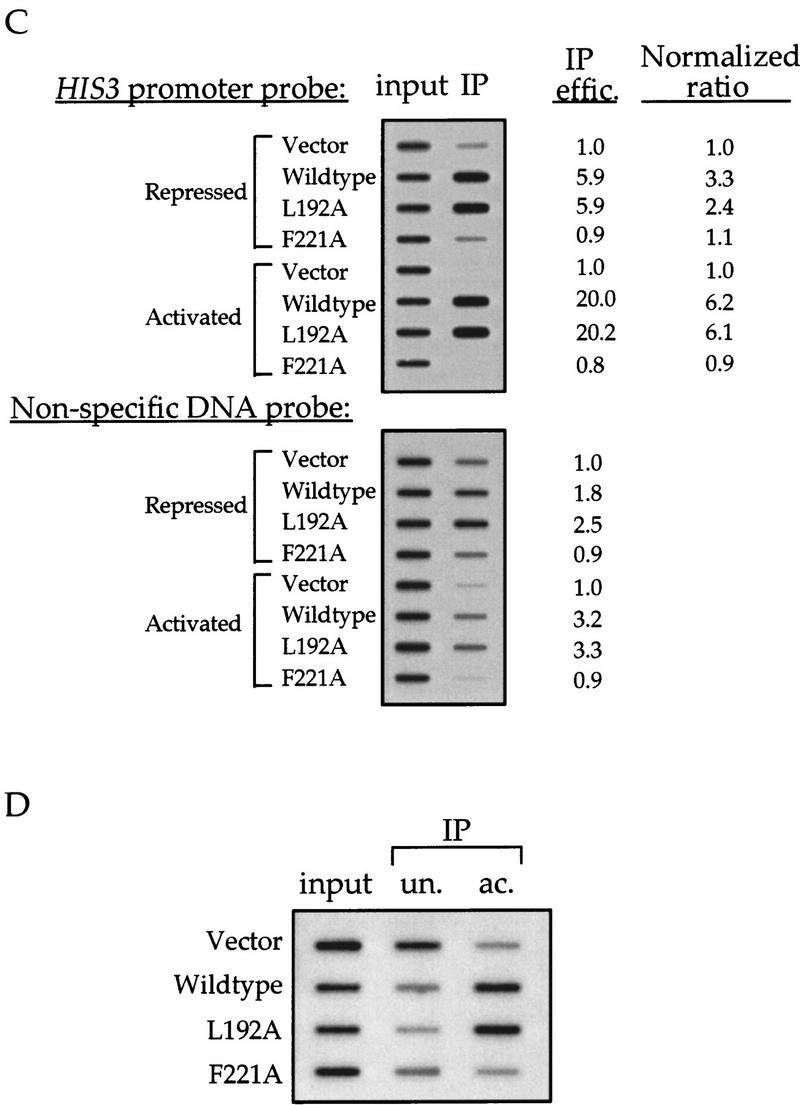
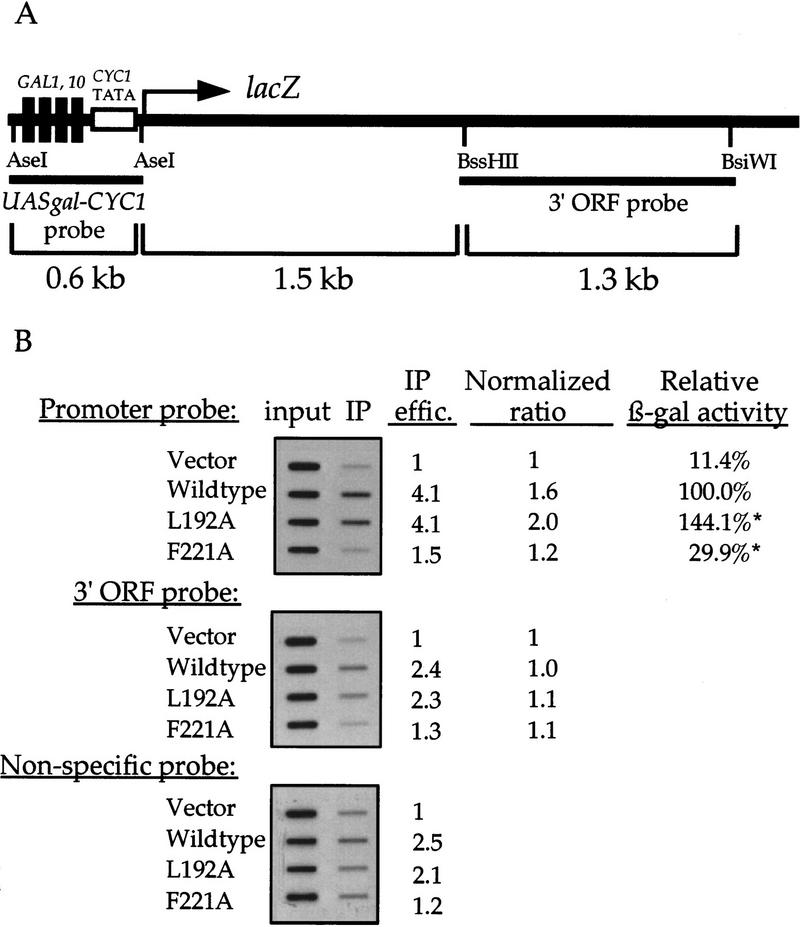
Gcn5p is a transcriptional coactivator required for correct expression of various genes in yeast. Several transcriptional regulators, including Gcn5p, possess intrinsic histone acetyltransferase (HAT) activity in vitro. However, whether the HAT activity of any of these proteins is required for gene activation remains unclear. Here, we demonstrate that the HAT activity of Gcn5p is critical for transcriptional activation of target genes in vivo. Core histones are hyperacetylated in cells overproducing functional Gcn5p, and promoters of Gcn5p-regulated genes are associated with hyperacetylated histones upon activation by low-copy Gcn5p. Point mutations within the Gcn5p catalytic domain abolish both promoter-directed histone acetylation and Gcn5p-mediated transcriptional activation. These data provide the first in vivo evidence that promoter-specific histone acetylation, catalyzed by functional Gcn5p, plays a critical role in gene activation.


Figures

Figure 1
Figure 1
Most conserved amino acid residues play an important role in histone acetylation in vitro. (A) Schematic diagram depicting the catalytic domain boundaries of yGcn5p (Brownell et al. 1996; Candau et al. 1997), amino acid sequences in HAT motifs I–IV, and sequence logos of each domain compiled from the sequences aligned in B. (B) Sequence alignments of Gcn5-type HATs, amino-acetyltransferases, and domain III homology regions from G10 proteins used in the analysis of the domain profiles shown in A. Color coding of the motifs corresponds to that in A. (C) Relative in vitro HAT activity of each mutant. Equivalent amounts of bacterially expressed Gcn5p derivatives were used for standard liquid HAT assays. Incorporation of the 3H-labeled acetate counts into histones was measured by scintillation counting and compared to wild-type Gcn5p. Shown are the relative HAT activity with the wild-type levels set to 100%. Vector only and wild-type controls were purified and assayed with every preparation of mutants analyzed to control for batch-to-batch variation; each mutant has been tested independently at least three times. Results are depicted from a single experiment; different shades of the bars represent each subdomain
Figure 1
Figure 1
Most conserved amino acid residues play an important role in histone acetylation in vitro. (A) Schematic diagram depicting the catalytic domain boundaries of yGcn5p (Brownell et al. 1996; Candau et al. 1997), amino acid sequences in HAT motifs I–IV, and sequence logos of each domain compiled from the sequences aligned in B. (B) Sequence alignments of Gcn5-type HATs, amino-acetyltransferases, and domain III homology regions from G10 proteins used in the analysis of the domain profiles shown in A. Color coding of the motifs corresponds to that in A. (C) Relative in vitro HAT activity of each mutant. Equivalent amounts of bacterially expressed Gcn5p derivatives were used for standard liquid HAT assays. Incorporation of the 3H-labeled acetate counts into histones was measured by scintillation counting and compared to wild-type Gcn5p. Shown are the relative HAT activity with the wild-type levels set to 100%. Vector only and wild-type controls were purified and assayed with every preparation of mutants analyzed to control for batch-to-batch variation; each mutant has been tested independently at least three times. Results are depicted from a single experiment; different shades of the bars represent each subdomain
Figure 2
Figure 2
In vivo tests of functions of mutant Gcn5p. (A) Growth complementation test. Shown are representative clones plated to synthetic minimal medium and grown at 30°C for 3 days before pictures were taken. All mutants have been tested at least three times for reproducibility. Note that certain mutations, such as Y220A, I174A/I179A, and G187A/G189A, consistently showed retarded growth. However, with long-termed storage at 4°C after 30°C incubation was completed, colonies of these strains reached the size close to that of wild-type strains. (B) Growth curves of four representative clones grown in minimal medium. (C) Transcriptional activation potency of Gcn5p derivatives. gcn5 null cells were first double-transformed with the GAL4–VP16 and β-gal expression constructs (both are 2 μ plasmids) followed by different GCN5 alleles (CEN/ARS minichromosomes). The β-gal expression was measured from exponentially growing cells and presented here as the percentage of that activated by wild-type Gcn5p; each mutant has been assayed independently three to ten times. The relatively wide range of standard errors of certain samples is at least partially attributable to the copy number variation of the GCN5 plasmid (data not shown).
Figure 2
Figure 2
In vivo tests of functions of mutant Gcn5p. (A) Growth complementation test. Shown are representative clones plated to synthetic minimal medium and grown at 30°C for 3 days before pictures were taken. All mutants have been tested at least three times for reproducibility. Note that certain mutations, such as Y220A, I174A/I179A, and G187A/G189A, consistently showed retarded growth. However, with long-termed storage at 4°C after 30°C incubation was completed, colonies of these strains reached the size close to that of wild-type strains. (B) Growth curves of four representative clones grown in minimal medium. (C) Transcriptional activation potency of Gcn5p derivatives. gcn5 null cells were first double-transformed with the GAL4–VP16 and β-gal expression constructs (both are 2 μ plasmids) followed by different GCN5 alleles (CEN/ARS minichromosomes). The β-gal expression was measured from exponentially growing cells and presented here as the percentage of that activated by wild-type Gcn5p; each mutant has been assayed independently three to ten times. The relatively wide range of standard errors of certain samples is at least partially attributable to the copy number variation of the GCN5 plasmid (data not shown).
Figure 3
Figure 3
Overproduction of functional Gcn5p leads to hyperacetylation of histones in vivo. (A) Western analysis of overproduced Gcn5p. Yeast whole cell extracts (20 μg) prepared from strains overproducing various Gcn5p derivatives were resolved by SDS-PAGE (left) and blotted for Western detection with Gcn5p antibodies (right). Note that the endogenous Gcn5p was in a low abundance under our standard Western conditions. The overproduced GCN5 alleles are as follows: (lane 1) Wild type; (lane 2) vector; (lane 3) F221A; (lane 4) Y244A/E245A; (lane 5) G187A/G189A; (lane 6) I174A; (lane 7) L192A; (lane 8) G225A; (lane 9) T248A; (lane 10) wild type. Although there is a certain degree of expression variation of different Gcn5p derivatives, this variation is not likely sufficient to account for the dramatic difference in in vivo activity displayed by each allele. (B) Histones H3 and H4 are hyperacetylated in the presence of overexpressed functional Gcn5p derivatives. Purified core histones were resolved by 15% Triton–acetic acid–urea gel electrophoresis and visualized by silver staining. Acetylation ladders are marked on the side. Samples shown (left and right) were electrophoresed on separate gels. The same preparation of wild-type and vector samples were included on both gels for reference. Note that all three class 1 mutants showed a lower degree of H3 acetylation and subtle, but readily visible, effects on H4 acetylation.
Figure 4
Figure 4
Hyperacetylation of nucleosomal H3 is linked to the chromosomal copy of HIS3 activated by functional Gcn5p. (A) Source of the probes. The ORF probe was used only for Northern blot analyses. (B) Northern blot analysis of HIS3 transcription. The ratio of HIS3 expression, after normalization with ACT1 mRNA, was 1 : 1.8 : 2.5 : 0.9 : 6.0 : 19.4 : 19.3 : 8.2 (lanes 18). The generally lower expression of ACT1 under amino acid starvation is probably attributable to the complete lack of amino acids in the minimal medium during the 6-hr incubation before RNA extraction. (C) Chromatin IP results. Yeast cells were processed for immunoprecipitation of solubilized chromatin fragments using anti-H3.AcLys(9/14) antiserum. DNAs coprecipitated in these nucleosomal complexes were purified and analyzed by slot-blot hybridization. Relative IP efficiency (counts of the IP divided by those of the input) was obtained setting the value of the vector control slot as 1 in each hybridization result. The normalized ratio was derived by dividing the IP efficiency of each sample to that obtained when total genomic DNAs were used as a probe. (D) Chromatin IP using the antisera against unacetylated or hyperacetylated H3 shows comparable IP efficiency in different GCN5 backgrounds. Yeast extracts were subjected to ChIP using antisera against unacetylated (un.) or acetylated (ac.) H3 and the resultant slot-blots were first probed with HIS3 promoter sequence as above, followed by control probes, including ACT1 promoter and total genomic DNA, which showed essentially identical IP efficiency seen in Fig. 4C (data not shown).
Figure 4
Figure 4
Hyperacetylation of nucleosomal H3 is linked to the chromosomal copy of HIS3 activated by functional Gcn5p. (A) Source of the probes. The ORF probe was used only for Northern blot analyses. (B) Northern blot analysis of HIS3 transcription. The ratio of HIS3 expression, after normalization with ACT1 mRNA, was 1 : 1.8 : 2.5 : 0.9 : 6.0 : 19.4 : 19.3 : 8.2 (lanes 18). The generally lower expression of ACT1 under amino acid starvation is probably attributable to the complete lack of amino acids in the minimal medium during the 6-hr incubation before RNA extraction. (C) Chromatin IP results. Yeast cells were processed for immunoprecipitation of solubilized chromatin fragments using anti-H3.AcLys(9/14) antiserum. DNAs coprecipitated in these nucleosomal complexes were purified and analyzed by slot-blot hybridization. Relative IP efficiency (counts of the IP divided by those of the input) was obtained setting the value of the vector control slot as 1 in each hybridization result. The normalized ratio was derived by dividing the IP efficiency of each sample to that obtained when total genomic DNAs were used as a probe. (D) Chromatin IP using the antisera against unacetylated or hyperacetylated H3 shows comparable IP efficiency in different GCN5 backgrounds. Yeast extracts were subjected to ChIP using antisera against unacetylated (un.) or acetylated (ac.) H3 and the resultant slot-blots were first probed with HIS3 promoter sequence as above, followed by control probes, including ACT1 promoter and total genomic DNA, which showed essentially identical IP efficiency seen in Fig. 4C (data not shown).
Figure 5
Figure 5
UASgal–CYC1 promoter sequence is associated with hyperacetylated histones when lacZ is activated by functional Gcn5p. (A) A schematic diagram of the UASgal–CYC1–lacZ gene and the source of the probes used in the ChIP experiments. (B) Chromatin IP results. Assay conditions were essentially the same as HIS3 described in Fig. 4. When quantified using GCN5 gene as the probe, two samples (*) contained a higher copy number of the GCN5 plasmid (not shown); this probably accounts for the roughly twofold increase in β-gal expression when compared with data presented in Fig. 2C.

References

    1. Allfrey VG, Faulkner R, Mirsky AE. Acetylation and methylation of histones and their possible role in regulation of RNA synthesis. Proc Natl Acad Sci. 1964;51:786–794. - PMC - PubMed
    1. Axe DD, Foster NW, Fersht AR. Active barnase variants with completely random hydrophobic cores. Proc Natl Acad Sci. 1996;93:5590–5594. - PMC - PubMed
    1. Bailey TL, Elkan C. Fitting a mixture model by expectation maximization to discover motifs in biopolymers. In: Altman R, Brutlag D, Karp P, Lathrop R, Searls D, editors. Proceedings of the Second International Conference on Intelligent Systems for Molecular Biology. Menlo Park, CA: AAAI Press; 1994. pp. 28–36. - PubMed
    1. Bannister AJ, Kouzarides T. The CBP co-activator is a histone acetyltransferase. Nature. 1996;384:641–643. - PubMed
    1. Barlev NA, Candau R, Wang L, Darpino P, Silverman N, Berger SL. Characterization of physical interactions of the putative transcriptional adaptor, ADA2, with acidic activation domains and TATA-binding protein. J Biol Chem. 1995;270:19337–19344. - PubMed

Publication types

MeSH terms

LinkOut - more resources