. 1998 Mar 16;187(6):875-83.
doi: 10.1084/jem.187.6.875.

Flexible programs of chemokine receptor expression on human polarized T helper 1 and 2 lymphocytes

Affiliations

Flexible programs of chemokine receptor expression on human polarized T helper 1 and 2 lymphocytes

F Sallusto et al. J Exp Med. .

Abstract

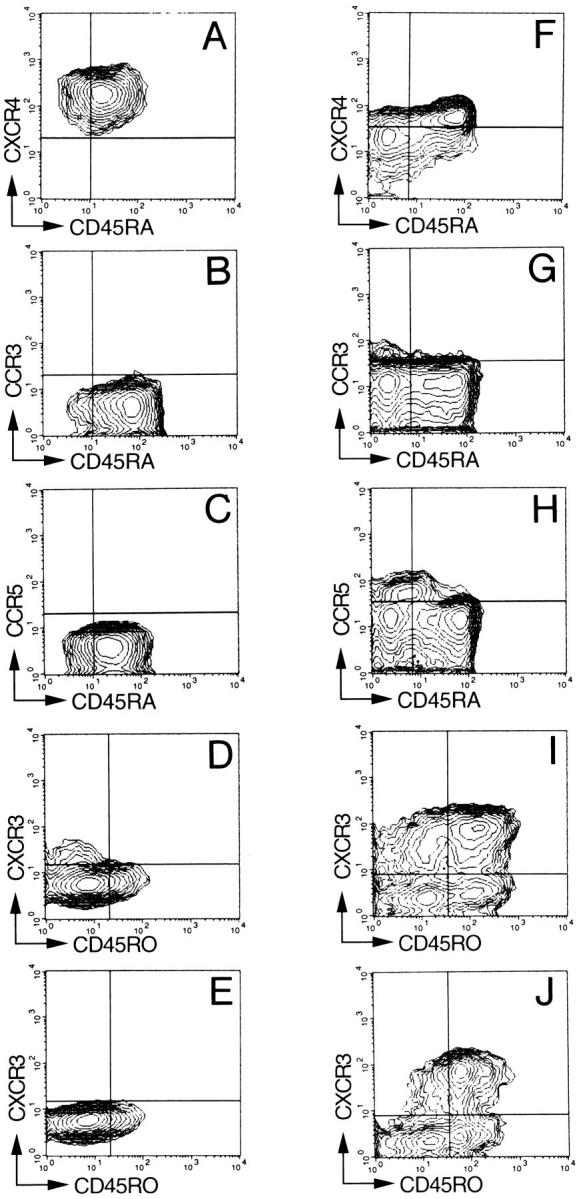
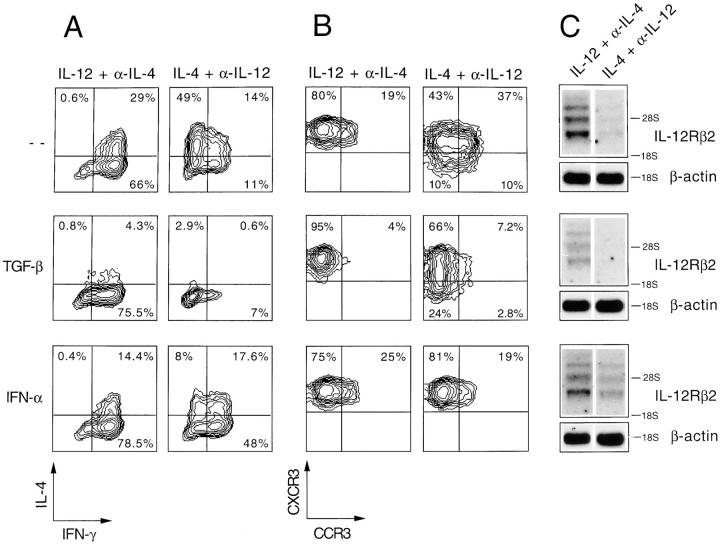
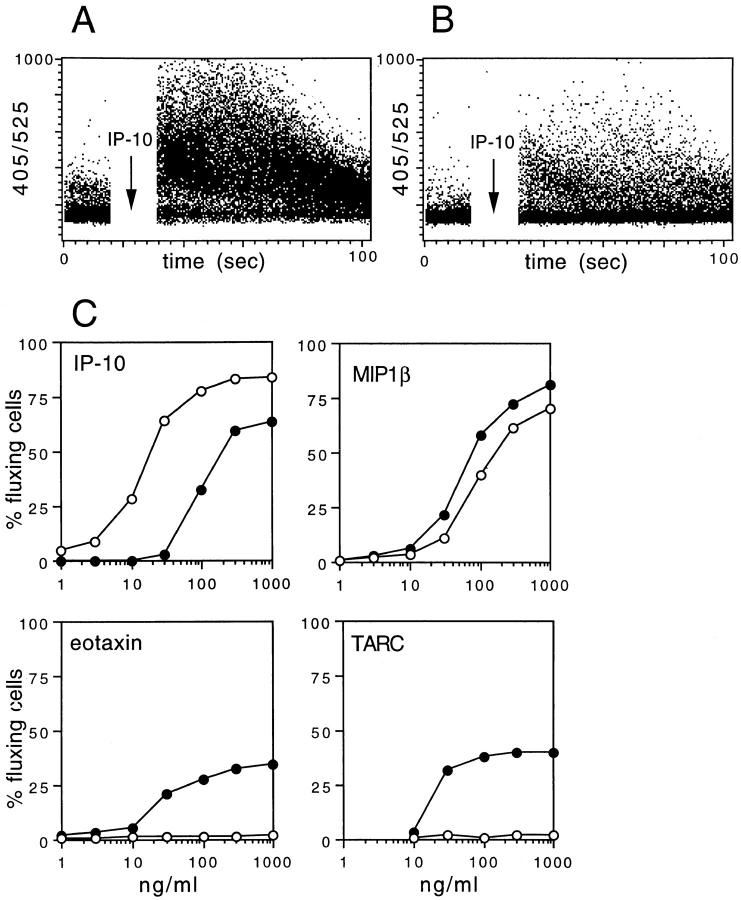
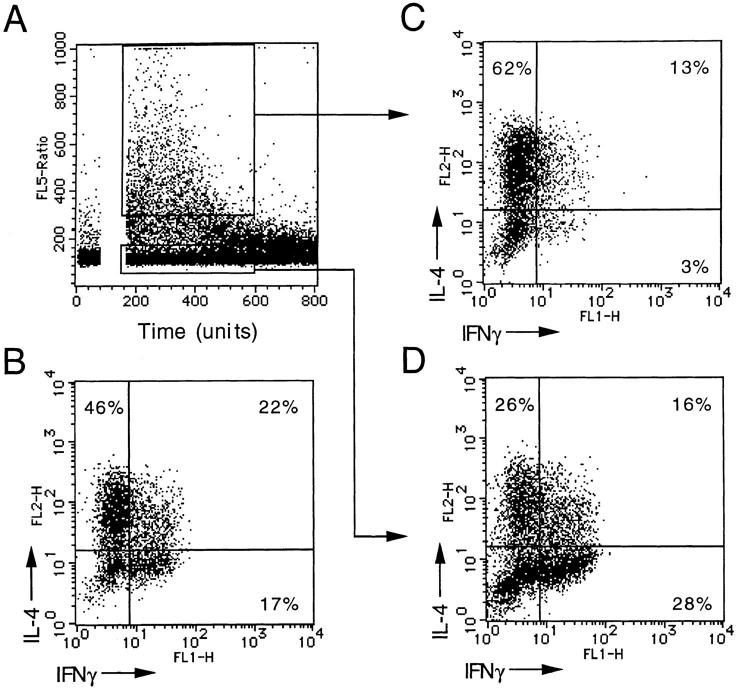
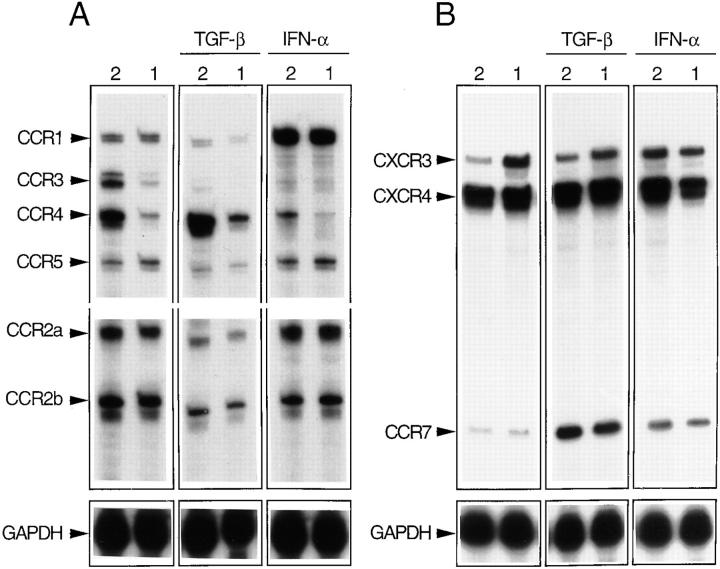
Chemokines and their receptors are important elements for the selective attraction of various subsets of leukocytes. To better understand the selective migration of functional subsets of T cells, chemokine receptor expression was analyzed using monoclonal antibodies, RNase protection assays, and the response to distinct chemokines. Naive T cells expressed only CXC chemokine receptor (CXCR)4, whereas the majority of memory/activated T cells expressed CXCR3, and a small proportion expressed CC chemokine receptor (CCR)3 and CCR5. When polarized T cell lines were analyzed, CXCR3 was found to be expressed at high levels on T helper cell (Th)0s and Th1s and at low levels on Th2s. In contrast, CCR3 and CCR4 were found on Th2s. This was confirmed by functional responses: only Th2s responded with an increase in [Ca2+]i to the CCR3 and CCR4 agonists eotaxin and thymus and activation regulated chemokine (TARC), whereas only Th0s and Th1s responded to low concentrations of the CXCR3 agonists IFN-gamma-inducible protein 10 (IP-10) and monokine induced by IFN-gamma (Mig). Although CCR5 was expressed on both Th1 and Th2 lines, it was absent in several Th2 clones and its expression was markedly influenced by interleukin 2. Chemokine receptor expression and association with Th1 and Th2 phenotypes was affected by other cytokines present during polarization. Transforming growth factor beta inhibited CCR3, but enhanced CCR4 and CCR7 expression, whereas interferon alpha inhibited CCR3 but upregulated CXCR3 and CCR1. These results demonstrate that chemokine receptors are markers of naive and polarized T cell subsets and suggest that flexible programs of chemokine receptor gene expression may control tissue-specific migration of effector T cells.


Figures

Figure 1
Figure 1
Chemokine receptor expression on naive and memory peripheral blood T cells. Three-color immunofluorescent staining of mononuclear cells from cord blood (A–E) or adult blood (F–J). Contour plots represent live cells gated for expression of CD3 (A–D and F–I) or CD4 (E and J). In different panels, memory T cells are identified as CD45RA or CD45RO+ because of constraints in the choice of antibody isotypes (see Materials and Methods). Quadrants were set according to the staining of control mAbs. The CD3+ CD45R0 CXCR3+ cells were identified as CD8+ cells in separate experiments. Comparable results were obtained with three additional cord blood and six adult blood samples.
Figure 2
Figure 2
Acquisition of CXCR3, CCR5, and CCR3 after T cell polarization in vitro. Cord blood T cells were activated for two consecutive cycles under Th1- (IL-12 + α–IL-4) or Th2- (IL-4 + α–IL-12) polarizing conditions. The cells were analyzed for IFN-γ and IL-4 production by intracellular staining (dot plots in a four-decade logarithmic scale) and for expression of chemokine receptors (histograms in a four-decade logarithmic scale) 10 d after the first polarization (A) and 10 d after the second polarization (B). Comparable results were obtained in three additional experiments.
Figure 3
Figure 3
Modulation of IFN-γ and IL-4 production and CCR3 and CXCR3 expression in polarized T cell lines by TGF-β and IFN-α. Cord blood T cells were polarized by two consecutive cycles of stimulation in the presence of IL-12 + α-IL-4 (Th1) or IL-4 + α-IL-12 (Th2) alone or together with TGF-β or IFN-α. (A) IFN-γ and IL-4 production at the single cell level measured by intracellular staining (four-decade logarithmic scale); (B) CCR3 and CXCR3 expression (four-decade logarithmic scale); (C) IL-12Rβ2 mRNA expression as determined by Northern blot on total RNA using as probe the full-length human IL-12Rβ2 subunit cDNA. Exposure time was 7 d using an intensifying screen at −70°C. Two major messages were found as described (42). As a loading control, the blot was stripped and rehybridized for β-actin.
Figure 4
Figure 4
Differential response to chemokines of Th1 and Th2 lines. (A and B) Time course of [Ca2+]i increase in Th1 (A) and Th2 (B) T cell lines stimulated with 100 ng/ml IP-10. (C) Percent of fluxing cells in Th1 (open circles) and Th2 (closed circles) lines stimulated with various concentrations of the indicated chemokines. The percentage of fluxing cells was calculated cumulatively over a 1-min period after the addition of chemokine. Comparable results were obtained with two additional cell lines as well as with several T cell clones.
Figure 5
Figure 5
TARC-responsive cells are Th2. (A) A polyclonal Th2-polarized cell line was loaded with Indo-1 and challenged with 100 ng/ml TARC. Fluxing and nonfluxing cells were sorted over a 1-min period. Unsorted (B), and sorted fluxing (C) and nonfluxing (D) T cells were stimulated with PMA + ionomycin for 4 h and IFN-γ and IL-4 were measured by intracellular staining.
Figure 6
Figure 6
CCR4 is preferentially expressed on Th2s and CCR1 and CCR7 are upregulated by IFN-α and TGF-β. Chemokine receptor message was determined by RNase protection assay using the multiprobe template sets hCR5 (A) and hCR6 (B, see Materials and Methods). T cell lines generated under Th2- or Th1-polarizing conditions in the absence or in the presence of TGF-β or IFN-α were analyzed. The results are representative of one out of three experiments with consistent results. The upregulation of CCR7 in cultures supplemented with IFN-α was not reproduced in other experiments.
Figure 7
Figure 7
Chemokine receptor expression on T cell clones. (A–C) IFN-γ and IL-4 production and chemokine receptor expression (both on four-decade logarithmic scale) on three representative Th0, Th1, and Th2 clones; (D) CXCR3 expression level and (E) percent of CCR5+ cells in Th0, Th1, and Th2 clones. The mean and standard deviation for each group is also shown. No direct correlation was found in the expression of CXCR3 and CCR5. T cell clones were defined according to cytokine profile (Th0, IFN-γ and IL-4; Th1, IFN-γ and no IL-4; Th2, IL-4 and no IFN-γ).

References

    1. Mosmann TR, Coffman RL. TH1 and TH2 cells: different patterns of lymphokine secretion lead to different functional properties. Annu Rev Immunol. 1989;7:145–173. - PubMed
    1. Romagnani S. Lymphokine production by human T cells in disease states. Annu Rev Immunol. 1994;12:227–257. - PubMed
    1. Mackay CR. Homing of naive, memory and effector lymphocytes. Curr Opin Immunol. 1993;5:423–427. - PubMed
    1. Springer TA. Adhesion receptors of the immune system. Nature. 1990;346:425–434. - PubMed
    1. Butcher EC, Picker LJ. Lymphocyte homing and homeostasis. Science. 1996;272:60–66. - PubMed

Publication types